Download

1 / 15
150 likes | 259 Views
Rainwater Reuse Modeling. Houston Land/Water Sustainability Forum June 17, 2009. Jay Morris. Introduction. Goals Questions to Obtain Goals Rainwater Runoff Quantity Storage Volume Selecting Areas to Capture Rainfall Data – Supply Usage – Demand How Supply and Demand Affect a Model

E N D
Rainwater Reuse Modeling Houston Land/Water Sustainability Forum June 17, 2009 Jay Morris
Introduction • Goals • Questions to Obtain Goals • Rainwater Runoff Quantity • Storage Volume • Selecting Areas to Capture • Rainfall Data – Supply • Usage – Demand • How Supply and Demand Affect a Model • Return on Investment (ROI) • Recap
Goals • To provide an economically viable alternative to municipal water for non-potable uses. • Achieve a LEED® point for SS Credit 6.1. Case 1 (site less than 50% impervious): “…prevent the post-development peak discharge rate and quantity from exceeding the pre-development peak discharge rate and quantity”
Questions to Obtain Goals • What is the difference in runoff quantities from pre-developed to post-developed conditions? • How much water should be stored? • From where should water be collected? • What can the water be used for? • How can supply and demand be balanced? • What is the ROI?
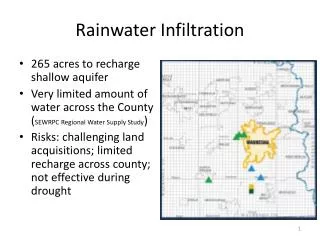
Rainwater Runoff Quantity The change in the runoff volume is the volume to be infiltrated into the soil or reused onsite to achieve LEED® SS Cr. 6.1. In Houston infiltration is limited due the soil’s low percolation rate. • ΔV = Change in Volume of Runoff (CF) • AImp = Total Impervious Area (SF) • ΔCRunoff = Change in Runoff Coefficient (SF) • d2year = Depth of 2-Year 24-Hour Rainfall (FT) ΔV = Aimp (ΔCRunoff )(d2year)
Rainwater Runoff QuantityExample ΔV = Aimp (ΔCRunoff )(d2year) 10,000 SF of impervious area is proposed for a development in Fort Bend County. The pre-developed runoff coefficient is assumed to be 0.35 and the impervious area runoff coefficient is assumed to be 0.95. The Fort Bend County Drainage Criteria Manual References TP-40 which states that the point rainfall amount (depth) of the 2-year 24-hour storm is 4.90 inches for Fort Bend County. AImp = 10,000 SF, ΔCRunoff = 0.95-0.35 = 0.60, d2year = 4.90 IN ∆V = 10,000 SF x 0.60 x (4.90 IN/ 12IN/FT) = 2,450 CF 2,450 CF (7.48 Gal/CF) = 18,326 Gal
Storage Volume • Calculating the runoff volume for the 2-year 24-hour storm establishes the minimum volume needed to meet LEED® SS Credit 6.1. • The volume needed can also be driven by upfront cost, desired drawdown time, and available site area. • If the difference in pre and post-developed 2-year 24-hour runoff volumes is not stored and reused, LEED® SS Credit 6.1 will be difficult to achieve.
Selecting Areas to Capture • This process will be site specific and will likely involve collection from roof drains in an urban area and more geared towards overland flow, swales, etc. for suburban or rural areas. • Natural drainage patterns will also affect what areas can be captured. • The sites outfall location(s) shall also be considered.
Rainfall Data – Supply • Actual Daily Data vs. Monthly Average Data • Daily data will more accurately depict how often the storage volume will go dry. • Rainfall data for at least 10 years is preferred. • Daily rainfall data is available at www.srh.noaa.gov for most major airports and a number of other monitoring locations.
Usage - Demand • Potential uses include irrigation, greywater, condensers, fire suppression, livestock, fountains and pools. • Usage estimates can be determined from a variety of different sources including water bills, manufacturer specifications and many resources available online. • Consider seasonal usage when appropriate. • Account for evaporation from ponds and pools.
How Supply and Demand Affect a Model EXCEL MODEL
Return on Investment • The most basic estimate: (1-% Empty)(Yearly Usage)(Water Rate) = Yearly Savings Yearly Savings/Upfront Cost = Years to Payback • This does not account for storm sewer savings, the rising cost of water, maintenance costs, etc.
Recap • Determined Storage Volume • Delineated Areas to Capture • Quantified Available Rain • Quantified Usage • Combined All Variables to Determine the Systems Functionality
References Technical Paper No. 40 http://www.nws.noaa.gov/oh/hdsc/PF_documents/TechnicalPaper_No40.pdf Southeast Texas Climate Data http://www.srh.noaa.gov/hgx/climate.htm Texas Manual on Rainwater Harvesting http://www.twdb.state.tx.us/publications/reports/RainwaterHarvestingManual_3rdedition.pdf City of Houston Discharge Criteria – for estimating usage http://documents.publicworks.houstontx.gov/document-center/planning-and-development-services-division/dicharge-criteria-sheet/details.htm