Download
1 / 11
110 likes | 177 Views
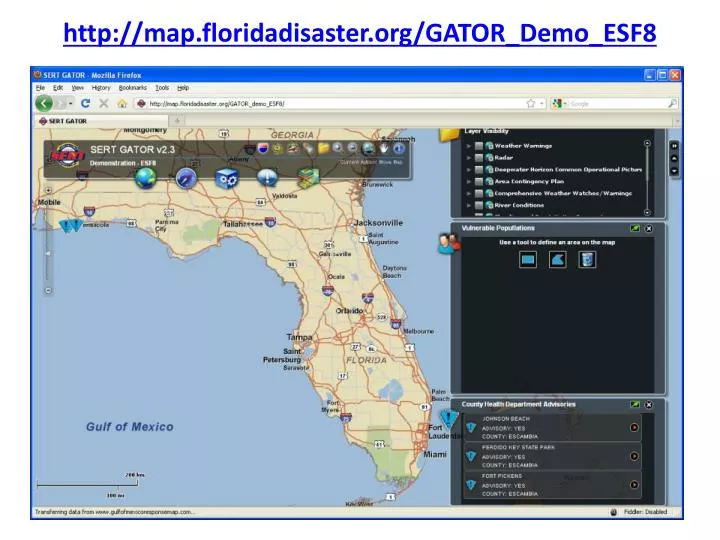
http://map.floridadisaster.org/GATOR_Demo_ESF8. At the initial view, mention how during Deepwater Horizon Response, map services from FDOH were added directly to GATOR to display health advisories.

E N D
At the initial view, mention how during Deepwater Horizon Response, map services from FDOH were added directly to GATOR to display health advisories. • Zoom in to southeast Florida by selecting the Zoom In tool , click and hold the left-click button on the mouse, draw a rectangle, and release the left-click button.
Under the Vulnerable Population tool, click Select by Rectangle, place the cursor over the map, click and hold, dragging a rectangle.
Mention how the total population and total disabled are now displayed, along with a pie chart for age.
Click on the pie chart to toggle to the composition of the disabled population.
Zoom in again, if needed. • Under Layer Visibility, scroll down, find Critical Facilities, and check to turn them on.
Click the Identify tool • Place the cursor over the map, over a Hospital or Health Care Facility, and click.
Under Search, verify Vulnerable Population Profile Maps is selected, click Select by Point, place the cursor over the map and click.