Download
1 / 50
510 likes | 655 Views
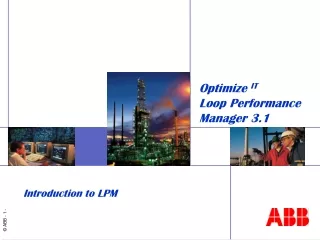
cpmPlus Loop Performance Manager 3.2. Introduction to LPM. Presentation Outline. Introduction / Motivation cpmPlus LPM Features Tuning Control Performance Monitoring Supporting Utilities cpmPlus LPM Plant-wide Disturbance Analysis. cpmPlus Loop Performance Manager.

E N D
cpmPlus Loop Performance Manager 3.2 Introduction to LPM
Presentation Outline • Introduction / Motivation • cpmPlus LPM Features • Tuning • Control Performance Monitoring • Supporting Utilities • cpmPlus LPM Plant-wide Disturbance Analysis
cpmPlus Loop Performance Manager 1. Introduction/Motivation
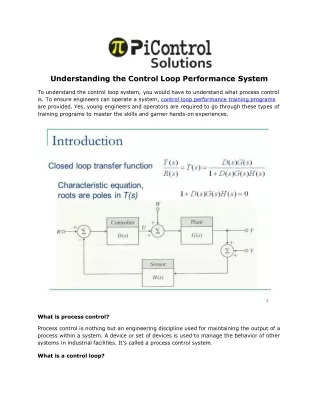
Why Loop Performance Monitoring? • “Does my plant run optimally?” • If not, how much can be accounted to the process automation, especially the control loops?” • We should use available measurement data instead of just storingit. • Normal operation does not necessarily mean optimal operation • Loop optimization saves money without new capital investments
An investment that has to pay off! • Typical control loop as a $25,000 asset • Half of it is lost • 50 % well tuned • 25 % uneffective control • 25 % decrease performance • Half time of good performance = 6 months • 2 – 4 hours to investigate and improve control performance • Typical process contains 2000 – 4000 control loops • Only few people with appropriate know-how • Average process engineer in charge of 400 control loops • 25 % of 4000 loops do harm, this means… waste of 25,000,000 $ !!!
Analysts start to get the message Recent issue: “Include control loops in asset management” Quotes: • “…while process equipment is an integral part of AM [asset management] programs, control loops … often don’t receive the same attention.” • “Performance of control loops … degrades slowly over time with little fanfare.” • “Without properly tuned control loops to minimize variability, … substantial benefits are lost.” • “… even a slight degradation in process control can result in millions of dollars in lost profitability.” • “Identifying the high-payback control loops requires evaluating all control loops, which would be an insurmountable taskwithout the aid of control loop performance monitoring and analysis software.” • “When first installed, advanced process control typically provides substantial benefits. Sustaining those benefits due to changing conditions, however, has been a problem.” • “… it’s a good time to ensure control systems are part of your AM efforts.” Les A. Kane, Editor
Benefits of Tuning and Auditing • Maintains control system at its peak • Loop Tuning • Enables the plant engineers to reach loops optimum performance with significant time savings (vs. manual tuning) • Loop Auditing • Provides timely indication of equipment/automation/process problems. In this way it easy to keep the loop at their , allowing to stay at the optimal performance • Also, it provides stable foundation for multivariable/advanced control
cpmPlus Loop Performance Manager – What is it? Loop Tuning • Challenge • Optimal PID Tuning is critical to efficient process operation • Loop Tuning is a time consuming activity • Typically, only expert engineers can perform Tuning • Solution • LPM Tuningmakes definition of optimal PID parameters an easy, reliable & manageable task Loop Auditing • Challenge • Loop optimization is frustrating, because after few months all results seem lost due to the process variability • Plant engineers have to look at hundreds of signals and among them detect possible problems • Solution • Once Loop Optimization is performed, LPM Auditing monitors loops and allows the process engineer to immediately address problem areas
High High High Dream Cost Low Low Low Time Time Time Reality Cost Realistic dream with Auditing Cost Cost of bad control Loop Tuning Execution
cpmPlus Loop Performance Manager 2. LPM Features
Log Tune Model Collect Configure LPM Tuning – Workflow • Which step to tune a Loop?
LPM Features – Data Collection • Configure database by loops • Simultaneous data collection for multiple loops • OPC connectivity • Direct connection for Infi90/Symphony • Data collections stored as object on navigation tree for future retrieval • Possibility to exploit auditing automatic data collection for tuning purposes
LPM Tuning - Identification • BASIC for not experts and ADVANCED with fully scalable complexity for expert control engineers • Manual or Automatic structure selection by best fit • Parameters specified - up to 4th order • Identification also with Process in Close Loop • Validation • Model simulated with another data set • Evaluation • Ideal step response • Bode diagram BASIC ADVANCED
LPM Tuning • 5 Tuning methods available • Time domain analysis • Frequency analysis • Support many vendor specific PID controller types • Ability to model, tune, and analyze Feedforward control loops. Considers feedback tuning. • Special treatment of Cascade control loops
LPM Advanced Tuning Features • New Tuning values can be assessed on model different from the ones used to obtain the tuning set (Simulate Mode) • Data pre-processing functionalities • Advanced Feedforward Loop Tuning Management • HTML-based and information-richer Tuning Logs • Advanced Cascade Loop Tuning Management
LPM Tuning – Advantage • State of the art Tuning Algorithm, but with user-friendly tool to make Advanced Control Theory accessible to every Plant Engineers • Ready for every DCS • OPC connection • Calculated PID parameters (Kp, Ti, Td ) with the definition of your DCS • Identification also with Loop in normal Close Loop Mode • Not only basic PIDs, but also FeedForward and Cascade Loop Control Tuning becomes easy, fast, profitable
Tuning - Design stage Assessment stage Performance Assessment: Tuning vs. Auditing Reasonable design ? Slightly tight design Is this good control? If not: why?
LPM Auditing - General concept • based on available signals only(SetPoint, PV, CO) • available information can be incorporated • performance indices, measures • inference engine • suggest remedies Info know how I1, I2, I3, … know how Hypothesis, Diagnosis
Basic statistics Data Validity Control loop modes Tuning Performance indices Oscillation indices Valve indices Target “SP” Controller Output “CO” Measurement “PV” Kinds of Performance Indices in LPM • Nonlinearity indices • Property indices • Housekeeping • Special indices • Continuous indices
Kinds of Diagnoses in LPM Performance indices • Indices plus know-how organized in a Root-Cause analysis elaborate Maintenance Suggestions • Diagnoses dealt with problems in: Tuning, Actuators and Sensors, External disturbance + Maintenance Diagnoses Auditing Rules
excellent good fair poor Overall Performance PRECONDITIONS Acceptable performance index Harris index Acceptable setpoint crossings index Setpoint crossing index (not for Level Control) Variability random Oscillation index of control error Controller output within range Saturation index Loop automatic Automatic mode index Acceptable cascade tracking Cascade tracking index (if in cascade) Acceptable response speed ACF to horizon index Acceptable Overall performance
Start auditing Setpoint CO,PV Data collection Indices calculation Database Indices Reports Excel, HTML Indices Trend Plot Diagnoses Report Excel, HTML Output Periodical reports • Process Engineer • Investigate Problem • Activate Maintenance • Maintenance Operator • Repair device • Tuning Maintenance Auditing workflow • Loop configuration • Assign • TAG connection • Signal ranges • Loop Type • Auditing configuration • Assign • Data collection schedule • Batch / continuous auditing • Loop category configuration • Assign • Sampling rate • Batch duration • Report configuration • Assign • Report layout Configuration file Configuration
F FC Example oscillation investigation... cycling load Diagnoses • Verify overall Performance • Detect oscillation • Decide among the 3 causes static friction tight tuning Indices • Oscillation details (period, amplitude…) • Amount of problem for every causes • Trend plot for every index
LPM Auditing - KPI Reporting & Analysis • Reporting • Pre-defined report templates • Both numerical and chart-based assessment
Advanced Auditing Features • Advanced Indices & Diagnosis trend facility (on multiple even non consecutive periods) • User-defined Indices • Enhanced KPI and Diagnosis set • Server Status Monitor to supervise all the auditing functions • “What Is Changed” report to immediately eye-catch recently developed events • Possibility to generate a “Detailed Loop” Report, with in-depth charts and numerical figures
Detailed Report • Time domain view (PV,SP,CO) • Power spectrum view (PV) • Statistical view (PV, CE) • CE vs. CO, during oscillation becomes a ring. From the shape it is possible to detect stiction • Impulse response of Disturbance Rejection • Sensitivity study for Prediction horizon (good situation when lines is increasing with steps) Power spectrum PV Time domain PV-SP,CO Statistical domain CE,CO Osc.-stiction Sensitivity to Pred.horiz. Impulse response
And More … • Operation-Sensitive Reports: allow to monitor control loops according their operating region(s) • Examples: production campaign types, loads, … • Capability to extract and utilize for Tuning purposes data automatically collected during Auditing normal operation
Bulk Database Import for quick DB Configuration • Allows to import tag configuration details from Excel spreadsheets • Results in Relevant Manpower Savings
Infi90/AC800F Bulk Import Tool Available as an add-on to standard LPM Functions
LPM auditing - Everything also by Web Facility to get and manage all LPM information from any location in the net From the LPM Home Page it is possible to navigate to … … Reports Configuration … … Reports Retrieval … … Tuning Logs
LPM Auditing: Advantages • Automatic data-collection enable actual continuous loop performance assessment rather than “sporadic sampling”, maximizing the chance to identify and correct insurgent production-related problems • Simple, straightforward diagnostic indications are made available for the basic user or for quick assessment • Diagnostic results are based on sophisticated indices which are able to provide explanations or in depth analysis for advanced user or when needed • Both Diagnosis and Indices are saved and stored in user-configurable Reports so to not require continuous attention from plant crew and to provide a comprehensive “plant history” track record
cpmPlus Loop Performance Manager 3. Plantwide Disturbance Analysis
Plant-wide disturbance analysis - intro • Analysis process data off-line • Searches for data pattern in time (oscillations) and frequency (specra) to identify • Oscillations • Interactions • Identifies most likely root-cause (with no info on plant topology/interconnections) • Integrated in LPM, could use auditing data or external data (e.g. plant historian)
1 TI TI 6 6 FC FC 2 Internal Condenser Internal Condenser PDI TI PDI 2 39 PI 1 20 3 Decanter 2 TI 19 7 1 3 TC Steam 32 1 FC 4 TC 8 TI 16 FC Column 2 TI 22 3 Column 1 4 TI 4 10 TC 4 3 1 TI FC 5 FC 5 3 TI 9 LC 1 LC 1 FC Steam 7 PI Steam PI 2 LC 2 TC 2 PDA Application – Case 1 Cascaded Distillation Columns:
PDA Application – Case 1:Dataset Details • Primary cycle • Column 1 level through column 2 distillate • Cause is LC2 valve movement problem • Many variables cycling together • Secondary cycle • Top of column 1 (distillate FC2 and temperatures) • Cause is FC2 valve movement problem • 96 hours total data, sample time = 30 sec Dataset window chosen
PDA Application – Case 1: Clustering • Three main Clusters detected: • Two Oscillation Clusters • One PCA Cluster • A few tags have been added to clusters due to process considerations Oscillation Clustering: manually added 1 related tag to grouping (primary cycle)
PDA Application – Case 1: Clustering • Three main Clusters detected: • Two Oscillation Clusters • One PCA Cluster • A few tags have been added to clusters due to process considerations Default grouping: secondary cycle, had to add ti2.pv and ti3.pv tags manually
PDA Application – Case 1: Clustering • Three main Clusters detected: • Two Oscillation Clusters • One PCA Cluster • A few tags have been added to clusters due to process considerations PCA cluster default grouping, manually added 2 related tags to grouping (primary cycle)
Decanter PDA Application – Case 1: Main Clustered Disturbances 1 TI TI 6 6 FC FC 2 Internal Condenser Internal Condenser PDI TI PDI 2 39 PI 1 20 3 2 TI 19 7 1 3 TC Steam 32 1 FC 4 TC 8 TI 16 FC Column 2 TI 22 3 Column 1 4 TI 4 10 TC 4 3 1 TI FC 5 FC 5 3 TI 9 LC LC 1 1 FC Steam 7 PI Steam PI 2 LC 2 TC 2
PDA Application – Case 1: Root Cause Analysis Good default results for non-linearity analysis (primary cycle) (ranks LC2 as highest non-linearity)
PDA Application – Case 1: Root Cause Analysis FC2 cycle (secondary cycle) analysis: non-linearity correctly identifies FC2
Decanter PDA Application – Case 1: Disturbance Propagation 1 TI TI 6 6 FC FC 2 Internal Condenser Internal Condenser PDI TI PDI 2 2 39 PI 1 20 3 TI 19 7 3 1 TC Steam 32 1 FC 4 TC 8 TI 16 FC Column 2 TI 3 22 Column 1 4 TI 4 10 TC 4 3 1 TI FC 5 FC 5 3 TI 9 LC LC 1 1 FC Steam 7 PI Steam PI 2 LC 2 TC 2 Cluster 1 Cluster 2
PDA Application – Case 2 Vaporizer System: Vapor Header PC 1 Steam Steam Steam Steam SP 2 5 PC PC FC FC 9 2 5 9 7 C D PI LC LC LC LC A B PI 7 7 9 Liquid Liquid Liquid Liquid
Cycle of interest PDA Application – Case 2: Clustering • Two main Clusters detected: • One Oscillation Clusters • One PCA Cluster • A few tags have been added to clusters due to process considerations
PDA Application – Case 2: Root Cause Analysis Ref. to: “Peak Performance: Root Cause Analysis of Plant-wide Disturbances”, ABB Review 1/2007 Good results for non-linearity, clearly identifies LC2 as root cause
Tuning With LPM Process Engineers (also non expert in control theory) can optimize Loop behavior Benefits: increase process profit, more stable working condition, more safety operations PDA Very valuable insight on process corrrelations, oscillations and root causes with a few points and click Could use your historian data (with reasonable data compression) Complementary to tuning and auditing Auditing Control Performance Monitoring is non-invasive, simple to perform and very efficient LPM detects automatically problem at the beginning of their occurrence Performance monitoring nowadays answers the most important questions to help the plant personnel to pinpoint and remove problems The right information to the right people cpmPlus - LPM Conclusions