Download
1 / 29
290 likes | 397 Views
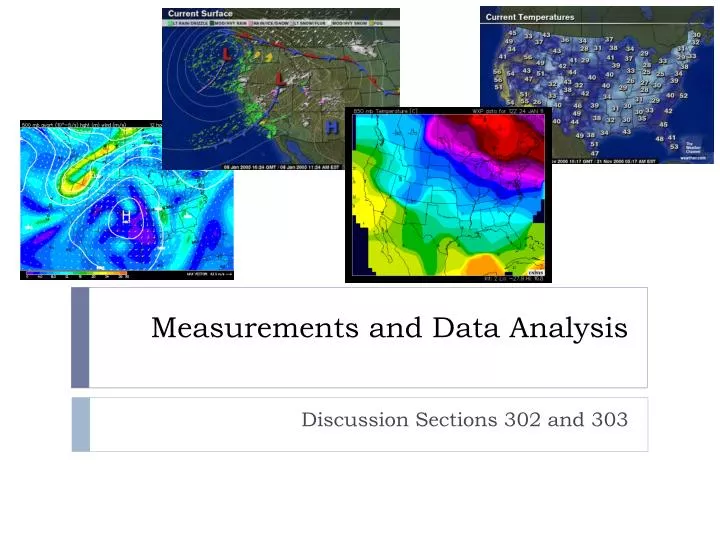
Measurements and Data Analysis. Discussion Sections 302 and 303. Weather Discussion. NCEP NAM Model. Surface/Precip 1200Z 850 mb/Temp 1200Z 300 mb/Wind speed 1200Z 850-800 mb/Relative Humidity 1200Z. Radar/Satellite. Current Radar Loop Current Satellite Loop Current Water Vapor Loop.

E N D
Measurements and Data Analysis Discussion Sections 302 and 303
NCEP NAM Model • Surface/Precip 1200Z • 850 mb/Temp 1200Z • 300 mb/Wind speed 1200Z • 850-800 mb/Relative Humidity 1200Z
Radar/Satellite • Current Radar Loop • Current Satellite Loop • Current Water Vapor Loop
Observations and Measurements • Station models • Observations taken at a particular weather station • Observations are taken simultaneously across the nation several times a day • Ensures accuracy of forecast models • Now that we have our observations, what do we do? • There are some missing points in-between the observations • Large variations in those observations from place to place • We need to contour!
Coordinated Universal Time (or Zulu Time) • Atmospheric scientists use a coordinated universal time (UTC) • Z stands for Zulu • Examples • 0800Z • 1531Z • 2130Z • Essentially the same as Greenwich Mean Time (GMT)
Converting from UTC • Central Standard Time (CST) • November 7th 2010 - March 13th 2011 before 2 am • Central Daylight Time (CDT) • March 13th 2011 after 2 am – November 6th 2011 • How to convert to CST and CDT • CST • Subtract 600 from the time • Ex. 1700Z – 600 = 1100 (which is 11 am) • CDT • Subtract 500 from the time • Ex. 2100Z – 500 = 1700 (which is 5 pm)
Weather Maps • Importance of contoured maps • Easy diagnosing and depicting weather features and variables • Ex. Predicting atmospheric fronts, hurricanes, storms, etc. • Give easy-to-read, general information about small to large areas
Contouring • Contouring is the process of drawing isopleths • An isopleth is a line of equal value • iso – equal • pleth – value • A contour analysis involves drawing multiple isopleths • Each isopleth has a different name depending on the contour analysis
How to Contour • Interpolate between given values to correctly place an isopleth • Think about the contour as a line separating the observations with higher values on one side of the line, and lower values on the other side 5 5
How to Contour • Locate regions of high and low values first • Example • Draw the 15 °Fisotherm 15 15
How to Contour • Contour at evenly spaced increments • Example • Draw the 75 °Fand80 °Fisotherms 75 75 80 80
Circlular Isopleths • Sometimes, you will find the values are localized • In this case, you would draw a circle • Draw the 20°Fand25 °F isotherms 20 20 20 25 25
7 8 9 6 5 8 6 11 10 9 8 7 11 11 9 10 7 12 11 7 10 How to Contour • Isopleths cannot touch or cross • Isopleths cannot branch or fork NO! 10 9 10 10 9 10
How to Contour • Do not create contours where there is an absence of data
Preparing to Contour • Search for continuity (time and space) on the weather map • Eliminate what appears to be faulty or incorrect data • Ex: a 95 is found amongst 50s • Survey the map and look for: • Areas of rapid change (large gradients) • Steady areas (flat field) • Review data to determine isopleth spacing • Will you need to squeeze isopleths tightly? • Will you have room to label the isopleths?
Contouring Tips • Use a pencil • Draw smooth lines • Be neat and accurate • Label the isopleths
In-Class Examples Draw the 25°F - 50°F isotherms at 5°F intervals. 25 30 35 40 25 30 35 40 45 45 50 50
In-Class Examples Draw the isobars at 4 mb intervals, starting at 1000 mb .
Station Pressure Example • Only focus on the pressure • Convert 3 digit numbers to actual pressure • Remember, 032 => 1003.2 mb • Remove stations that do not have a pressure reading • There are two of them • Draw lines at 4 mb increments above 1000 mb • 1004 mb, 1008 mb, 1012 mb, 1016 mb, etc.