Download
1 / 21
210 likes | 302 Views
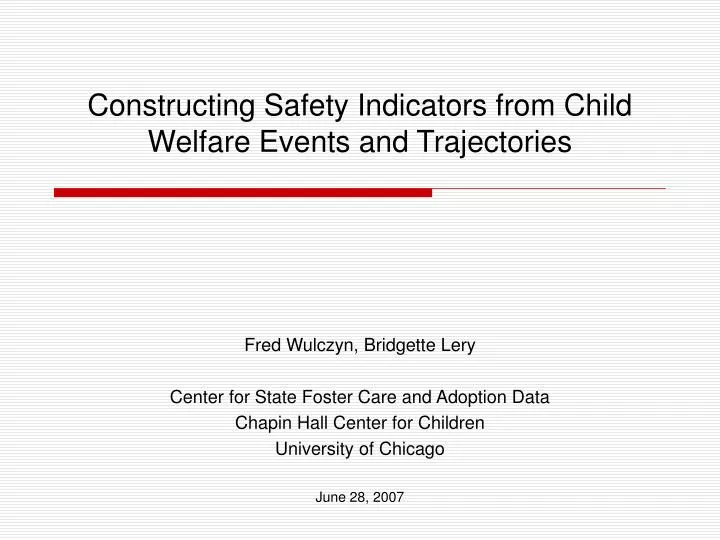
Constructing Safety Indicators from Child Welfare Events and Trajectories. Fred Wulczyn, Bridgette Lery Center for State Foster Care and Adoption Data Chapin Hall Center for Children University of Chicago June 28, 2007. Questions.

E N D
Constructing Safety Indicators from Child Welfare Events and Trajectories Fred Wulczyn, Bridgette Lery Center for State Foster Care and Adoption Data Chapin Hall Center for Children University of Chicago June 28, 2007
Questions At what stage or stages of involvement in the child welfare system does disparity originate? Do subsequent stages aggravate or mitigate the disparity? Policy question Do policies interact, contributing to disproportionality, in the name of other positive outcomes?
Definitions • Disproportionality One population is out of proportion with respect to a reference population • Disparity A lack of equality: likelihood of placement, likelihood of exit, time to exit, and exit type
Trajectories Trajectories are strings of events in temporal sequence. Captured events in this jurisdiction are: • UNSUB • SUB • OPEN • PLACE • DISCH • CLOSE
Study Details • Children who first came into contact with the child welfare system in 2001 or 2002 in one jurisdiction • Followed each child for two years and captured the first four events • Captured race/ethnicity and age at first contact • Calculated rates of contact at each level of system involvement • Followed changes in the racial mix of the caseload at various junctures including selected common trajectories such as: • SUB/OPEN • SUB/OPEN/PLACE • SUB/SUB/SUB
100% 90% 80% 76% 72% 71% 70% 60% 56% African American 50% 44% White 40% 29% 28% 30% 24% 20% 10% 0% OPEN SUB UNSUB ANY Caseload Mix at Initial System Contact
100% 90% 80% 70% 60% 53% African American 50% 42% White 35% 34% 40% 24% 30% 20% 12% 10% 0% OPEN SUB UNSUB Distribution of First Contacts by Type and Race
100% 90% 80% 68% 70% 65% 60% African American 50% White 40% 30% 26% 24% 20% 10% 3% 3% 3% 3% 3% 2% 0% CLOSE NO_SECOND PLACE SUB UNSUB Given a Case Opening, What is Likely to Happen Next?
100% 90% 80% 70% 57% 60% African American 50% 44% 43% White 40% 25% 30% 20% 9% 8% 8% 6% 10% 0% NO_SECOND OPEN SUB UNSUB Given a Substantiated Report, What is Likely to Happen Next?
100% 90% 76% 80% 70% 65% 60% 56% 60% 54% African American 46% 50% 44% White 40% 40% 35% 30% 24% 20% 10% 0% OPEN/PLACE SUB/OPEN UNSUB/OPEN SUB/SUB ANY Caseload Mix After Selected Pairs of Events
100% 90% 80% 80% 67% 70% 62% 60% 60% African American 50% White 40% 38% 40% 33% 30% 20% 20% 10% 0% SUB/OPEN/PLACE UNSUB/SUB/OPEN SUB/SUB/SUB ANY Caseload Mix After Selected Triplets of Events
100% 90% 80% 71% 70% 65% 62% 60% African American 50% White 38% 40% 35% 29% 30% 20% 10% 0% Any First Event Any Two Events Any Three Events Summary: Caseload Mix
100% 90% 80% 76% 72% 71% 70% 70% 60% 58% Total African American 60% 56% 52% Total White 48% 50% 44% Babies African American 42% 40% 40% Babies White 30% 29% 28% 30% 24% 20% 10% 0% OPEN SUB UNSUB Any Babies vs. All: Caseload Mix at Initial Contact
Babies: Given a Substantiated Report, What is Likely to Happen Next?
100% 90% 80% 71% 70% 65% 62% 60% 60% Total African American 55% 53% Total White 47% 50% 45% Babies African American 40% 38% 40% Babies White 35% 29% 30% 20% 10% 0% Any First Event Any Two Events Any Three Events Summary: Caseload Mix for Babies vs. All
Limitations • We have not taken into account the length of time between events. • We have not looked at maltreatment type. • We only studied one jurisdiction. • We have not subjected the data to multivariate models. • Case opening is not a very good proxy for whether or not services were delivered.
Conclusions • The source of disparity in this jurisdiction is primarily at the point of first contact. • African American children are more likely than white children to have a case opened at any point. • Disparity is greatest for infants. • Could the disparity in case openings suggest an effective protective process?
Implications • Given that infancy is a unique developmental stage, we need to adjust strategies for dealing with that population in developmentally appropriate ways. • We must be careful in evaluating our options for addressing disproportionality. Policies and practices narrowly aimed to reduce disparities may sabotage other, good outcomes.