Download
1 / 25
250 likes | 372 Views
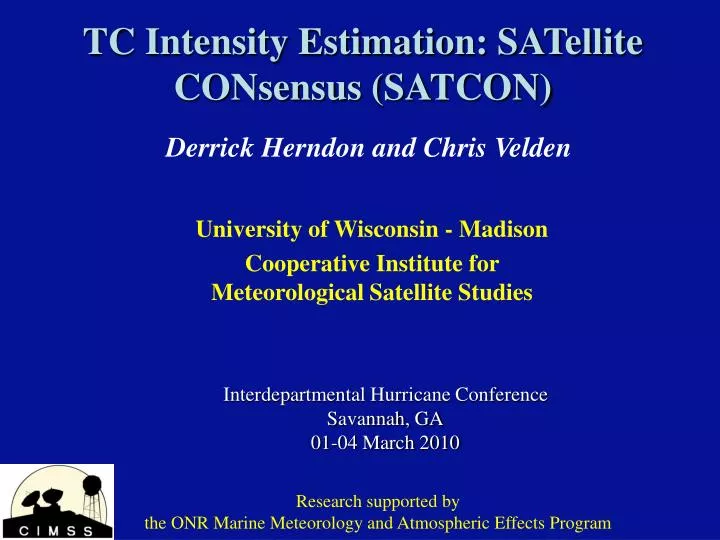
TC Intensity Estimation: SATellite CONsensus (SATCON). University of Wisconsin - Madison Cooperative Institute for Meteorological Satellite Studies. Derrick Herndon and Chris Velden. Interdepartmental Hurricane Conference Savannah, GA 01-04 March 2010. Research supported by

E N D
TC Intensity Estimation: SATellite CONsensus (SATCON) University of Wisconsin - Madison Cooperative Institute for Meteorological Satellite Studies Derrick Herndon and Chris Velden Interdepartmental Hurricane Conference Savannah, GA 01-04 March 2010 Research supported by the ONR Marine Meteorology and Atmospheric Effects Program
Motivation • Importance of getting current TC intensity right • Intensification trends > forecasts • Predictor for statistical forecast models • Climatology (Basin Best Tracks) • Initial conditions for numerical models • Contemporary methods to estimate TC intensity can vary by more than 40 knots • Several objective TC intensity methods exist, but the goal of SATCON is to assist forecasters in assessing current intensity by combining the confident aspects of the individual objective estimates into a single “best” estimate
Clear Eye Pinhole Eye Large Eye Uniform Curved Band Shear SATCON Members • ADT (Advanced Dvorak Technique) • Uses IR imagery to objectively assess storm cloud patterns and structure to infer intensity • Latest version uses information from MW to make adjustments
SATCON Members: CIMSS AMSU Channel 8 150 mb Channel 7 250 mb 55 Knots 350 mb Channel 6 AMSU Tb Anomaly vertical cross section for Katrina 2005 70 Knots TC Pressure Anomaly Magnitude 125 knots AMSU Channel 8 Tb Anomaly Magnitude
SATCON Members: CIRA AMSU AMSU-A Tb are used to produce a statistical temperature retrieval at 23 pressure levels. Estimates of Vmax are then determined from the thermal warm core structure. IR image from NRL TC Page
SATCON The strengths and weaknesses of each method are assessed based on statistical analysis, and that knowledge is used to assign weights to each method in the consensus algorithm based on situational performance to arrive at a single intensity estimate
Another component of SATCON is cross-method information sharing • What relationships might exist between the parameters of the member algorithms? • Can some of the unique information from these parameters be shared between the algorithms to improve the individual members? • Corrections can be made to improve the performance of each algorithm, then the weights re-derived to produce an improved weighted consensus
SATCON cross-method information sharing ADT Estimate of Eye Size Example: ADT to AMSU In eye scenes, IR can be used to estimate eye size CIMSS AMSU uses eye size information to correct resolution sub-sampling Compare to AMSU-A FOV resolution Adjust AMSU pressure if needed
Information Sharing Example: Objective estimates of eye size from CIMSS ‘ARCHER’ method (using MW imagery) Currently, AMSU uses IR-based eye size or values from op center if no eye in IR. MW imagery (MI) often depicts eyes when IR/ADT cannot ARCHER method (Wimmers and Velden, 2010) uses objective analysis of MI and accounts for eyewall slope ARCHER eye = 33 km Information can be input to AMSU method
SATCON Weighting Scheme • Weights are based on situational analysis for each member • Separate weights for MSW and MSLP estimates • Example criteria: scene type (ADT) scan geometry/sub-sampling (AMSU) Example: ADT Scene type vs. performance SHEAR CDO EYE RMSE 14 knots RMSE 12 knots RMSE 18 knots
Examples ADT determines scene is an EYE CIMSS AMSU: Good, near nadir pass. Eye is well resolved by AMSU resolution CIRA is sub-sampled by FOV offset with TC center SATCON Weighting: ADT = 28 % CIMSS AMSU =47 % CIRA AMSU = 25 %
Examples ADT determines scene is a SHEAR scene CIMSS AMSU indicates no sub-sampling present CIRA AMSU: little sub-sampling due to position offset from FOV center Center of TS Chris SATCON Weighting: ADT = 18 % CIMSS AMSU =41 % CIRA AMSU = 41 %
1999-2009 performance stats (Vmax) - Atlantic Dependent sample. Values in knots. Validation is best track Vmax coincident with aircraft recon +/- 3 hours from estimate time. Negative bias = method was too weak.
1999-2009 SATCON compared to a simple straight consensus (Atlantic) Dependent sample. Vmax validation in knots vs. BT. MSLP validation in hPa vs. recon. Negative bias = method was too weak. SIMPLE is simple average of the 3 members
1999-2009 SATCON compared to operational Dvorak (Atlantic) Dependent sample. Vmax validation in knots vs. BT. MSLP validation in hPa vs. recon. Neg. bias = method was too weak. Dvorak is average of TAFB and SAB estimates
SATCON Web Site http://cimss.ssec.wisc.edu/tropic2/real-time/satcon
Summary A weighted consensus of three objective satellite-based methods to estimate TC intensity (SATCON) shows skill compared to conventional Dvorak-based methods. Independent trials during 2008 and 2009 in the Atlantic support the dependent sample results. SATCON also showed skill vs. other methods in the WestPac during TPARC/TCS-08 in 2008 (small sample of validated cases). SATCON is run experimentally on all global TCs in real-time, with the information available on the CIMSS TC web site.
References Brueske K. and C. Velden 2003: Satellite-Based Tropical Cyclone Intensity Estimation Using the NOAA-KLM Series Advanced Microwave Sounding Unit (AMSU). Monthly Weather Review Volume 131, Issue 4 (April 2003) pp. 687–697 Demuth J. and M. DeMaria, 2004: Evaluation of Advanced Microwave Sounding Unit Tropical-Cyclone Intensity and Size Estimation Algorithms. Journal of Applied Meteorology Volume 43, Issue 2 (February 2004) pp. 282–296 Herndon D. and C. Velden, 2004: Upgrades to the UW-CIMSS AMSU-based TC intensity algorithm. Preprints, 26th Conference on Hurricanes and Tropical Meteorology, Miami, FL, Amer. Meteor. Soc., 118-119 Olander T. and C. Velden 2007: The Advanced Dvorak Technique: Continued Development of an Objective Scheme to Estimate Tropical Cyclone Intensity Using Geostationary Infrared Satellite Imagery. Wea. and Forecasting Volume 22, Issue 2 (April 2007) pp. 287–298 Velden C. et al., 2006: The Dvorak Tropical Cyclone Intensity Estimation Technique: A Satellite-Based Method that Has Endured for over 30 Years. Bulletin of the American Meteorological Society Volume 87, Issue 9 (September 2006) pp. 1195–1210 Wimmers, A., and C. Velden, 2010: Objectively determining the rotational center of tropical cyclones in passive microwave satellite imagery. Submitted to JAMC.
Analysis of Sat-Based TC Intensity Estimation in the WNP During TCS-08 Comparison of All Satellite-based Estimates – Vmax (Kts) Positive Bias indicates method estimates are too strong
Analysis of Sat-Based TC Intensity Estimation in the WNP During TCS-08 Comparison of All Satellite-based Estimates – MSLP (mb) Positive Bias indicates method estimates are too strong. 2mem SATCON RMSE= 4.7 Blind and Oper Dvorak conversion is Knaff/Zehr