Download

1 / 87
870 likes | 997 Views
District Data Workday. Fall 2013. Welcome to the District Data Workday . To access the Power Point L og into the MTSS Implementers Wiki @ www.wiki.inghamisd.org Click on District Data Review Page on the left side of the screen Click on Fall 2013 Click on the link for the Power Point

E N D
District Data Workday Fall 2013
Welcome to the District Data Workday To access the Power Point • Log into the MTSS Implementers Wiki @ www.wiki.inghamisd.org • Click on District Data Review Page on the left side of the screen • Click on Fall 2013 • Click on the link for the Power Point • Or download from your district flash drive!
I. GATHER Problem Identification District Data Workday Data-based Problem Solving II. STUDY Problem Analysis IV. DO Evaluate MTSS III. PLAN Implement
Purpose Leadership teams… • will have an opportunity to review the status of literacy, mathematics and/or behavior systems • will make Action Plans to continue to improve student achievement
Learning Targets I can articulate… • the purpose and value in a District Data Review. • how student outcomes data can inform the district about student performance. • how process data can inform the district about student performance. • how student outcome data and process data can be used together to inform district goals. • The purpose and steps in a problem solving process (gather data, identify and analyze problem(s), develop an action plan, evaluate the plan).
Agenda • Welcome • Data Overview • School Improvement Connections • Team Time • Lunch • Team Time • Meet back in ABC at 3:00 p.m.
Team Roles Facilitator Guide the discussion Keep the team focused Ensure the tasks on the Complete the Exit Slip are completed Time Keeper Make sure the team is moving through the process efficiently Have team in Room ABC at 3:00 p.m. ASSIST Manager Make any modifications to DIP Action Plan Recorder Record any “To Dos” generated by the team Send completed Action Plan to team members
Materials Provided • Problem Solving Guide (PSG) • PSG Worked Example • Data Folder • Appendix E (from Building Data Review) • PET-R/SWEPT • PET-R Administration Guide • Summary of Effectiveness • PET-M • PET-Middle School • PET-M Administration Guide • BSA • Glossary of Terms
Data Sets & Purpose Trend Outcome Process • PET-R (P) • SWEPT-R (P) • PET-M (P) • PET-M Middle School (P) • BSA (P) • Building Data Day – Appendix E (P) • Grade Level (AW) (IE) • Sub-group (AW) (IE) • Cohort • Explore (IE) or (ACT) • MEAP (IE or MISchoolData.org) • AIMsweb ROI by Measure for Reading & Math (IE) at Building Level (IE) • Summary of Effectiveness (P) • Above & Beyond Mathematics (AW) • Suspensions/Expulsions (SWIS or PowerSchool, Skyward) • Local Assessments (IE) AW = AIMsweb; IE = Illuminate Ed; P = Provided
Data Sets & Purpose Trend Outcome Process • PET-R (P) • SWEPT-R (P) • PET-M (P) • PET-M Middle School (P) • BSA (P) • Building Data Day – Appendix E (P) • Grade Level (AW) (IE) • Sub-group (AW) (IE) • Cohort • Explore (IE) or (ACT) • MEAP (IE or MISchoolData.org) • AIMsweb ROI by Measure for Reading & Math (IE) at Building Level (IE) • Summary of Effectiveness (P) • Above & Beyond Mathematics (AW) • Suspensions/Expulsions (SWIS or PowerSchool, Skyward) • Local Assessments (IE) AW = AIMsweb; IE = Illuminate Ed; P = Provided
Illuminate Ed Trend Data And now a word from John and Kelly… www.wiki.inghamisd.org www.inghamisd.org
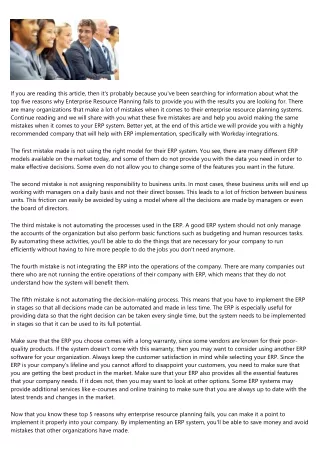
ACT EXPLORE College Readiness Graph
Are our students on track to be college ready when they graduate?
EXPLORE, PLAN, and ACT Think of these tests as one big yardstick. • EXPLORE8th and 9th grade (score range 1 to 25) • PLAN10th grade (score range 1 to 32) • ACT11th and 12th grade (score range 1 to 36)
College Readiness Standards for Reading begin on page 18 of this document. http://www.act.org/standard/
Data Sets & Purpose Trend Outcome Process • PET-R (P) • SWEPT-R (P) • PET-M (P) • PET-M Middle School (P) • BSA (P) • Building Data Day – Appendix E (P) • Grade Level (AW) (IE) • Sub-group (AW) (IE) • Cohort • Explore (IE) or (ACT) • MEAP (IE or MISchoolData.org) • AIMsweb ROI by Measure for Reading & Math (IE) at Building Level (IE) • Summary of Effectiveness (P) • Above & Beyond Mathematics (AW) • Suspensions/Expulsions (SWIS or PowerSchool, Skyward) • Local Assessments (IE) AW = AIMsweb; IE = Illuminate Ed; P = Provided
Illuminate Ed Outcome Data And now a word from John and Kelly… www.wiki.inghamisd.org www.inghamisd.org
Summary of Effectiveness Tables What are they good for?
Summary of Effectiveness tables are used to check on the health of a school wide system of support at the building level and a district system of support when used by a district leadership team. • They are used to track the movement of groups of students between Tier 1, Tier 2 and Tier 3.
We can use them to answer the following questions— • Are we keeping at least 95% of our students in Tier 1 that began the school year in Tier 1? This helps to determine the effectiveness of our core instruction. • Are we moving at least 80% of the students that began the year in Tier 2 into Tier 1? This measures the effectiveness of our instruction for the students that are at-risk. • Are we moving at least 80% of the students that began the year in Tier 3 into Tier 1 or Tier 2? This measures how effectively we are meeting the needs of our students that need to make a great deal of progress in a short time.
Be Kind to Yourself The Summary of Effectiveness tables that reflect the movement between tiers in Ingham County are typically falling at or below 50%. Celebrate the grade levels that show more than 50% of the students are progressing from Tier 2 to Tier 1, or from Tier 3 to Tier 2 or Tier 1 but don’t be satisfied. The pursuit of excellence must be relentless!
The following is an example of what you will see on your SOE table.
If you need these directions please ask Mary Jo or Melanie. They will be provided on a flashdrive.
Data Connections Activity • Pick a piece of candy from the bowl on your table. • Take one Candy Gram activity sheet from your table and find another individual (not from your district)that has the same piece of candy. • Ideas to share with one another… • How data sets reviewed so far are used in each district? • What other types of trend or outcome data is used in your district? • What sub-groups does your district look at? • How often does your leadership team review data?
AIMSweb report: Above and Below Target Quick glance across all grades, all screening periods.
Behavior: EWS and Learning Outcomes WHERE? SWIS: www.pbisapps.org • Suspensions and Expulsions • Office Discipline Referrals • Relevance across K-12
Behavior: EWS and Learning Outcomes WHY? Suspensions/Expulsions: • 6 hours of academic instruction lost per day • Assess against outcome data (literacy & math) • Assess disproportionality (ethnicity, grade, etc.) • Early Warning Systems: One or more suspensions… * Other PowerSchool EWS: Absent > 3/marking period
Behavior: EWS and Learning Outcomes WHY? Office Discipline Referrals: • 45 minutes of administrator time lost 500 ODRs/year = 375 hours or 62.5 school days ($25, 800) • 20 minutes of instructional time lost 500 ODRs/year = 167 hours or 28 school days • Assess against outcome data (literacy & math) • Assess disproportionality • > 2 ODRs by October predicts > 6 per year • Relevance for Policy: 3 ODRs -> suspension Tier I and II interventions for behavior
Data Sets & Purpose Trend Outcome Process • PET-R (P) • SWEPT-R (P) • PET-M (P) • PET-M Middle School (P) • BSA (P) • Building Data Day – Appendix E (P) • Grade Level (AW) (IE) • Sub-group (AW) (IE) • Cohort • Explore (IE) or (ACT) • MEAP (IE or MISchoolData.org) • AIMsweb ROI by Measure for Reading & Math (IE) at Building Level (IE) • Summary of Effectiveness (P) • Above & Beyond Mathematics (AW) • Suspensions/Expulsions (SWIS or PowerSchool, Skyward) • Local Assessments (IE) AW = AIMsweb; IE = Illuminate Ed; P = Provided
PET/SWEPT What are they good for?
The PET and SWEPT are used to check on the health of a school wide system of support at the building level. • The PET and SWEPT items indicate the research-validated actions that should be in place to pave the way for a healthy MTSS system for reading and math.
We can use them to answer the following questions— • We have less than 80% of our students at benchmark. What might be happening in our core instruction that might be contributing to that? What can we do to improve? • Research indicates specific areas that will improve outcomes. These include Goals/Objectives/Priorities, Assessment, Instructional Practices and Materials, Instructional Time, Differentiated Instruction/Grouping, Administration/Organization/Communication, Professional Development. Does our MTSS system have the most effective steps in place?
The following is an example of what you will see on your district graph of PET / SWEPT data
Barriers? The PET/SWEPT is a good guide for designing and improving a building MTSS system. However, it also can also present many perceived barriers to work around. Remember, think outside of the box! What can we do differently?
Finding the PET and SWEPT • Step 1—Click on Wiki Spaces on the IISD Home Page. It is at the bottom of the list that says FIND OUT MORE ABOUT… • Go to MTSS Implementers • Go to Building Data Review • Go to Fall 2013 • It is close to the bottom of the list, under Additional Resources
Building Self-Assessment (BSA) The Building Self-Assessment (BSA) monitors the extent to which schools are making progress toward full implementation of MTSS components. The BSA measures progress in consensus, infrastructure and implementation of an MTSS system.
Building-Self Assessment Consensus, Infrastructure, Implementation and Professional Development
Guiding Questions – Appendix B • Focus areas/components • Using the item graphs review the responses for the identified focus area(s). Record your findings. • What other data sources could you look at regarding the identified MTSS components?
Put the Data to Work— • Based on the review of your data, record any areas that you would prioritize as critical to investigate further on your district action plan (pg. 8). • How might this data be used in your District/Building School Improvement Plan or 40 performance indicators?
Appendix E What? • Summary of each building’s findings at the Building Data Day (Fall 2013) Why? • To help inform and guide District Action Plan