Download
1 / 21
210 likes | 268 Views
Stellar population results from NFPS: Age and Metallicity along the Red Sequence.

E N D
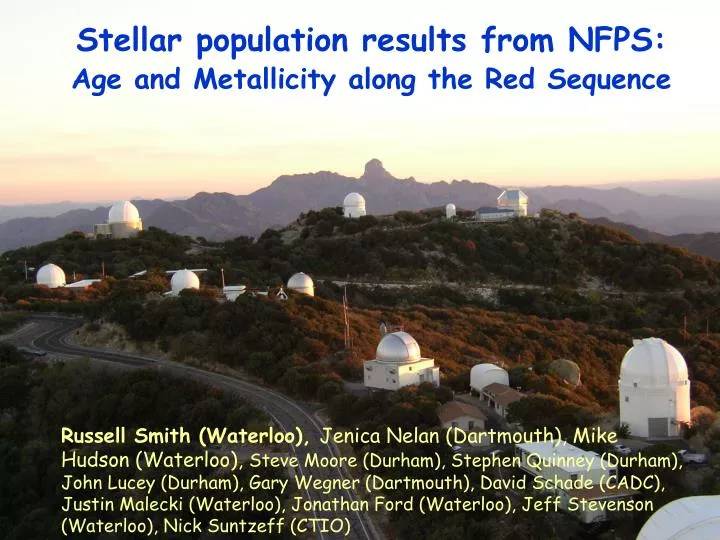
Stellar population results from NFPS: Age and Metallicity along the Red Sequence Russell Smith (Waterloo), Jenica Nelan (Dartmouth), Mike Hudson (Waterloo), Steve Moore (Durham), Stephen Quinney (Durham), John Lucey (Durham), Gary Wegner (Dartmouth), David Schade (CADC), Justin Malecki (Waterloo), Jonathan Ford (Waterloo), Jeff Stevenson (Waterloo), Nick Suntzeff (CTIO)
NFPS Primer Aims: Cosmic flows measure large-scale bulk flow at 150 h-1 Mpc with random, systematic and sampling errors < 100 km/s via FP measurements of an all-sky sample of ~100 nearby (z < 0.06) rich clusters Early-type galaxy properties in clusters benchmark sample of ~4000 galaxies withvery high quality, homogenous photometric and spectroscopic data Supported through NOAO Survey Program (50+ 4m nights) hence the NOAO FP Survey (NFPS) Smith et al. 2004, AJ, 128, 1558 (NFPS-I) Nelan et al. 2005, AJ, in press (NFPS-II)
Photometry • R and B band • FOV 40’ - 1 degree (CTIO 4m MOSAIC; KPNO 4m/0.9m MOSAIC; CFH12k) • Seeing <~1 arcsec; better for more distant clusters (CTIO/CFHT) • FP photometric parameters (Re, SBe) • Morphologies (bulge/disk decomposition with GIM2D) Spectroscopy • Spectroscopy follow-up for 30-70 colour-magnitude selected cluster members • WIYN 3.5m+HYDRA CTIO 4m+HYDRA, 2+ hours per field • FWHM 3Å; Median S/N is only 22 per Å (but we have ~4000!) • Overlap and multiple observations (crucial) • Redshifts, velocity dispersions, linestrength indices
Red Sequence of Cluster Galaxies Red-sequence galaxies dominate the stellar content of rich clusters …. Is the red-sequence a sequence of age or metallicity?
Typical literature results for early-type galaxies Thomas et al. (2005)
Co-added spectra, binned by sigma to S/N ~ 200 @ 5000A Co-added NFPS red-sequence spectra
Co-added spectra binned by sigma to S/N ~200 demonstrate the impressive regularity of the stellar populations of cluster red-sequence galaxies.
Sigma trends All absorption-line indices show significant variations with sigma Usual trends seen. Balmer lines negative, all others positive. (Emission-line galaxies excluded) Average in five bins. Best fit (solid lines). Predictions from our derived solution (dashed lines).
Initial comparison with the Thomas et al. models Grids: Thomas et al. alpha-enhanced “single stellar population” (SSP) models account for non-solar chemical abundances. Increasing age, [Z/H], [/Fe] with increasing σ Squares = binned NFPS values (each the average of ~700 galaxies), size increases with sigma value.
Grid Inversion Method Thomas et al. models predict variations of each linestrength index with age, [Z/H], [a/Fe] for each binned data point. Note errors on binned points. Thick lines show the average relations. Shaded regions indicate the maximum internal scatter.
Scaling Relationships for the Red Sequence Simultaneous comparison of slopes of 12 linestrength-index vs sigma relations to models …. … yields mean age, [Z/H], [a/Fe] variations for nuclear regions along the red-sequence. (red lines) Age ~ σ0.67 ± 0.15 [Z/H] ~ σ0.48 ± 0.05 [a/Fe] ~ σ0.35 ± 0.05
General trends in good agreement with other work in clusters (Trager et al., Caldwell et al., Thomas et al.) and in groups/field (Proctor et al., Denicolo et al.) but with much greater resolution. H absorption NFPS sub-sample gives the same result (Smith 2005). Stars in large galaxies formed early and quickly (high /Fe). Stars in small galaxies formed, on average, much later. Simplest interpretation: “down-sizing” onto the red sequence.
Deficiency of Red Sequence galaxies in high redshift clusters De Lucia et al. (2004) data for clusters at z ~ 0.75 shows a 50% deficit of faint (0.1-0.4 L*) red-sequence members which is approximately consistent with our result.
Predicted Age Trends from Models e.g. GALFORM filled: B/T > 0.6 open: 0.4< B/T < 0.6 Kuntschner et al. 2002 Field Cluster
Predicted [/Fe] trends from Models Thomas, Maraston & Bender (2002)
Caveats • Sample selection: • Red, emission-free cluster galaxies • No selection by morphological type • Results are for nuclear regions (~ 0.5 kpc) • Ages, metallicities are means of the red-sequence at a given velocity dispersion assuming a SSP model. This does not necessarily imply that their star formation histories were actually single bursts, e.g. “frosting” model may be able to produce the observed trends. To Do • Understand star formation history of bulge and disk components • GALEX, CFHT u*, K-band imaging • Morphologies from CFHT sub-arcsec imaging • Environmental effects • Trends with cluster mass, radius
Conclusions • From the detailed analysis of ~4000 spectra from red sequence galaxies in low redshift clusters we conclude that: • more massive galaxies on the red sequence are older, have higher overall metallicity, and have higher high [/Fe] than the lower mass galaxies • the red sequence was assembled slowly over cosmic history with the σ~ 50 km/s galaxies only reaching the red sequence about 4 Gyr ago • these results are incompatible with the generic predictions from the hierarchical galaxy formation models
Map the line strength trends into [/Fe], [Fe/H] and ages, via the Thomas et al. models.
NFPS Primer • Supported through NOAO Survey Program (50+ nights) • data collection is now complete • FP data for 30-70 red-sequence galaxies per cluster (<3% distance errors per cluster) … plus some field ellipticals out to z ~ 0.2. • provides benchmark sample of ~4000 local cluster E/S0 galaxies with very high quality photometric and spectroscopic data • the final SDSS sample of local cluster early-type galaxies will only be 1/3 size of NFP and will have poorer image quality. NFP sample has B/T ratios accurate to ~10% • an extremely powerful dataset to investigate many key aspects of local cluster early-type (red-sequence) galaxies • first NFP paper published, Smith et al. 2004, AJ, 128, 1558, second Nelan et al. 2005, in press.