Download
1 / 45
460 likes | 692 Views
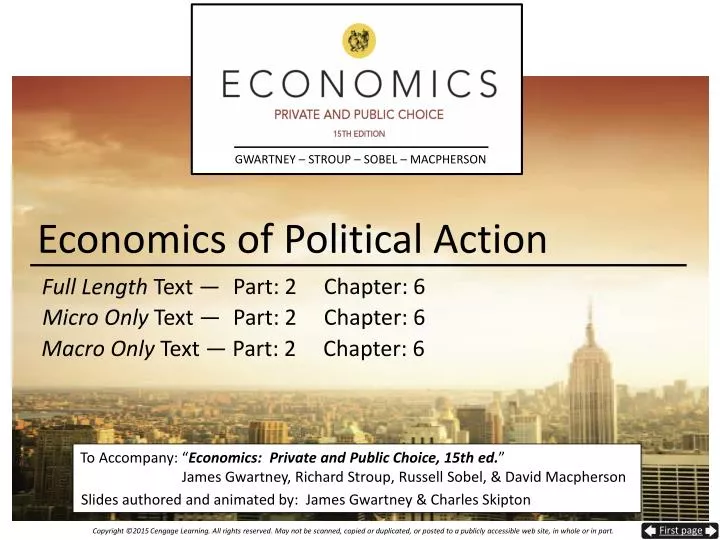
Economics of Political Action. The Size and Growth of the U.S. Government. Government Spending as a Share of the U.S. Economy: 1930 - 2012. The following slide shows total government spending (federal, state, and local) as a share of the US economy.

E N D
Government Spending as a Share of the U.S. Economy: 1930 - 2012 • The following slide shows total government spending (federal, state, and local) as a share of the US economy. • Total government spending accounted for only 9.4% of GDP in 1930; only one third of this spending was at the federal level. • Government spending, particularly at the federal level, soared from 1930 to 1980. Total government spending rose from 9.4% of GDP in 1930 to 32.8% in 1980 (more than 3 times its 1930 level). • After remaining fairly constant between 1980 and 2000, the size of the US government has increased dramatically since (increasing to 38% of the U.S. economy in 2012).
3.0 6.5 9.4 8.4 7.3 15.7 14.7 6.3 21.1 24.1 16.5 7.6 30.2 19.4 10.9 32.8 21.0 11.8 34.2 21.6 12.6 31.9 19.0 12.9 25.4 24.0 14.3 14.0 The Size of the US Government: 1930-2012 Government Expenditures as a Share (%) of GDP Federal 1930 State & local 1940 1950 1960 1970 1980 1990 2000 38.0 39.7 2010 2012
How the Federal Government Spends, 2011 Defense 19.6% Federal Spending (2011) = $3,603 Billion Social Security 20.3% NetInterest 6.4% Transportation2.6% Income Security 16.6% Other10.8% Medicare and health 23.8% Source: Economic Report of the President, 2013.
Utilities &liquor stores 7.0% How State and Local Governments Spend, 2010 State and Local Spending (2010) = $3,115 Billion Insurance trusts 8.2% Education29.1% Public welfare & Health 17.7% Police & Fire Protection 4.5% Transportation 5.4% Administration & other 24.7% Interest on debt 3.4% Source: US Census Bureau, State and Local Finances, 2010.
18.0% 17.4% 12.0% 11.7% 11.6% 8.3% 6.4% 5.9% 2.6% 1.1% The Growth of Government Transfer Payments Transfer Payments as a % of National Income • Transfer payments tax income from some and transfer it to others. • As is illustrated here, government transfer payments have grown rapidly since 1930. 1930 1940 1950 1960 1970 1980 1990 2000 2010 2012 Source:Bureau of Economic Analysis, http://www.bea.gov.
Similarities and Differences Between Political and Market Allocation
Differences and Similarities BetweenGovernment and Markets • Competitive behavior is present in both the market and public sectors. • Public sector organization can break the individual consumption-payment link. • Scarcity imposes the aggregate consumption-payment link in both sectors. • Private sector action is based on mutual agreement; public sector (when democratic)is based on majority rule.
Differences and Similarities BetweenGovernment and Markets • When collective decisions are made legislatively, voters must choose among candidates who represent a bundle of positions on issues. • Income and influence are distributed differently in the two sectors.
Public Choice Analysis • Public Choice analysis– applies the tools of economics to the political process in order to provide insight concerning how the process works. • Self-interested behavior is present in both market and political sectors. • The political process can be viewed as a complex interaction among three groups: • voter-taxpayers • politicians • bureaucrats
The Voter-Consumer • The Voter-Consumer: • Voters will tend to support those candidates who they believe will provide them with the most government services and transfer benefits, net of personal costs. • Rational Ignorance Effect: Recognizing their vote is unlikely to be decisive, most voters have little incentive to obtain information on issues and alternative candidates. • Because of the rational ignorance effect, voters will be uninformed on many issues; such issues will not enter into their decision-making process.
The Politician-Supplier • The Politician-Supplier: • Political officials are interested in winning elections. • Just as profits are the lifeblood of the market entrepreneur, votes are the lifeblood of the politician. • Rationally uninformed voters often must be convinced to “want” a candidate. • Legislative bodies, like a Board of Directors: • establishes the general direction of policy, • appoints and supervises bureaucrats who carryout the day-to-day operations of government, and, • sets the budgets of agencies and bureaus.
Government Bureaucrats • Civil servants (government bureaucrats) as political participants: • Bureaucrats (persons that handle day-to-day operations of government) seek promotions, job security, power, etc. • The interests of bureaucrats are often complementary with those of the interest groups they serve. • Larger budgets and program expansion generally serve the interests of both bureaucrats and their constituent groups.
Type1 Type2 Type4 Type3 Distribution of Benefits and Costs Among Voters • Consider how the 4 possible distributions of benefits and costs among voters affect the operation of representative government. Distribution of benefitsamong voters Widespread Concentrated Widespread • When benefits or costs are either both widespread or concentrated (type 1 or type 3), representative government tends to undertake projects that are productive and reject those that are unproductive. Distribution of costs among voters Concentrated
Type1 Type2 Type4 Type3 Distribution of Benefits and Costs Among Voters • When benefits are concentrated and costs widespread (type 2), representative government is biased towards the adoption of counterproductive (inefficient) activity. Distribution of benefitsamong voters Widespread Concentrated Widespread • Last, when benefits are widespread but the costs are concentrated (type 4), the political process often rejects productive projects. Distribution of costs among voters Concentrated
When Voting Works Well • Other things constant, legislators will have a strong incentive to support political actions that provide voters with large total benefits relative to costs. • If a government project is productive, it will be possible to allocate the project’s cost so that all voters will gain. • When voters pay in proportion to benefits received, all voters will gain if the government action is productive (and all will lose if it is unproductive). Under these circumstances, there is a harmony between good politics and economic efficiency.
$ 20 $ 5 $ 12.50 12 5 7.50 4 5 2.50 2 5 1.25 2 5 1.25 Benefits Derived by Voters fromHypothetical Road Project • Consider this government program. The total benefits ($40) exceed the tax cost ($25). It is, therefore, an efficient program. Tax payment • Under plan A, the tax cost ($5)imposed on each voter is the same. If decided by majority vote, the project would be rejected by a 3 to 2 margin. Benefitsreceived PlanA Plan B Voter Adams Chan Green • Under plan B each voter pays in proportion to benefits received. In this case, all voters gain and the program would pass unanimously. • This example shows that harmony between politics and economic efficiency exist when costs are allocated in proportion to benefits. Lee Diaz Total $40 $25 $25.00
Questions for Thought: • "The average person is more likely to make an informed choice when he or she purchases a laptop computer than when he/she votes for a congressional candidate." -- Evaluate this statement. • Does the motivation for political action differ from market action? Are people more greedy when they make market choices than when they make political choices?
Questions for Thought: 3. “Government action is based on majority rule, whereas market action is based on mutual consent.” Is this statement true or false? Is this point important? Why or why not? 4. Will efficient projects necessarily be favored by a majority of voters? Why or why not? 5. When the cost of a project is allocated among voters in direct proportion to the benefits derived, will democratic political decision making tend to accept projects that are efficient? Will it tend to reject projects that are inefficient? Discuss.
Questions for Thought: 6. (True or false)Market allocation and political process differ in that: (a) Competition is present in markets, but not in the political sector. (b) Scarcity is a constraint in markets but not in the political sector. (c) There is a one-to-one link between payment for and receipt of a good in markets, but this is not always true in the political sector. (d) Voter-consumers are generally well informed, but market decision makers are not. (e) Money influences market outcomes, but not political outcomes.
Special Interest Effect • A special interest issue generates large personal benefit for a small number of constituents while imposing a small individual cost on a large number of others. • Interest group members feel strongly about issues that provide them with substantial personal benefits. Such issues will dominate their political choices. • In contrast, voters bearing the cost of such legislation often are uninformed on the issue because it exerts only a small impact on their personal welfare and because of the rational ignorance effect.
Special Interest Effect • Politicians have a strong incentive to favor the views of special interests even if the action is inefficient. • Logrolling and pork-barrel legislation strengthen the special interest effect.
+ $10 - $03 - $03 + $4 - $03 + $10 - $03 + $4 - $03 - $03 + $10 + $4 - $03 - $03 - $03 - $9 - $03 - $03 - $03 - $02 - $02 - $02 - $6 - $9 Trading Votes and Passing Counterproductive Legislation • Consider a bill in Congress that would put a post office in district A, dredge a harbor in B, & build a military base in district C. –– Net Benefits (+) or Costs (-) to Voters in Respective District –– • Benefits to A, B, & C voters vary by project. New military base New PostOffice In total, voters in A, B, and C districts come out ahead despite the costs of paying taxes for activities in other districts – if they agree to vote together. Dredging harbor Voters of Total in C in A in B * district A B • With this bill, there are no benefits to voters in D and E; further, the sum of benefits & costs for all voters together is negative. C D E Total • With majority rule, representatives from districts A, B, and C, can, and often will, pass counterproductive legislation. * Assume the districts are of equal size.
When Voting Conflicts with Economic Efficiency • Shortsightedness Effect:Issues that yield clearly defined current benefits at the expense of future costs that are difficult to identify. • The political process is biased toward the adoption of such proposals even when they are inefficient. • The shortsightedness effect explains why politicians will find debt financing and unfunded promises attractive -- they make it possible for politicians to provide current benefits to voters without levying an equivalent amount of taxes (to pay for them).
When Voting Conflicts with Economic Efficiency • Rent Seeking:Actions by individuals and interest groups designed to restructure public policy in a manner that will either directly or indirectly redistribute more income to themselves. • Widespread use of the taxing, spending, and regulatory powers of government that favor some at the expense of others will encourage rent seeking. • Rent seeking diverts resources away from productive activities. The output of economies with substantial amounts of rent seeking will fall below their potential.
Income Transfers and Rent Seeking • Income transfers are a large and growing part of the U.S. economy. • There are three major reasons why large-scale redistribution will reduce the size of the economic pie: • When taxes take larger shares of one’s income, reward derived from work is reduced. • As public policy redistributes a larger share of income, more resources flow into rent-seeking. • Higher taxes to finance income transfers induce tax payers to focus less on income-generating activities and more on actions to protect their own income.
Economic Inefficiencyand Government Operated Firms • The structure of incentives and the efficiency of government operated firms and agencies • In the public sector, the absence of the profit motive reduces the incentive of producers to keep costs low. Neither is there a bankruptcy process capable of weeding out inefficient producers. • Public-sector managers are seldom in a position to gain personally from measures that reduce costs. • Because public officials and bureau managers spend other people’s money, they have less incentive to be cost-conscious.
Political Favoritism, Crony Capitalism, and Government Failure
Political Favoritism, Crony Capitalism, and Government Failure • As government spending, subsidies, income transfers, financial bailouts, and regulatory favors grow, businesses and other well-organized groups will expend more resources seeking to obtain government favors. • As a result, crony capitalism grows relative to market allocation. • Crony capitalism is the situation where the allocation of resources is determined by political favors rather than by consumer preferences translated through the market profit and loss system.
Political Favoritism, Crony Capitalism, and Government Failure • Under crony capitalism, rather than providing equal treatment of individuals and businesses under the law, government uses spending, subsidies, and regulations to favor those most willing to provide political decision-makers with campaign contributions and other forms of political support. • Economic inefficiency is the result.
“Bootleggers and Baptists” • Crony Capitalism is often driven by the bootlegger–Baptist strategy: greedy action packaged as moral behavior. • Opportunistic rent-seekers often frame their programs in a manner designed to attract support from naïve idealists. • They argue their programs will enhance child safety, promote energy independence, save family farms, or some other widely supported goal. • But when one looks below the surface, one discovers that these programs are about government favoritism providing handsome profits to the well organized special interest groups.
“Bootleggers and Baptists” • Bootlegger—Baptist examples include: • Mattel incorporating costly testing procedures into the Consumer Product Safety Improvement Act of 2008. • The action increased the costs of rivals and drove used toy sellers like Goodwill out of the market. • General Electric partners with environmentalists to advocate subsidies and tax breaks for alternative energy sources. • This government favoritism increased demand for GE turbine engines, solar panels, and wind farms. • Result: GE earned $15 billion in 2010 and paid zero corporate income taxes.
Market Entrepreneurs versus CronyCapitalists • Market entrepreneurs get ahead by providing consumers with products that are more highly valued than the resources required for their production. • Crony capitalists get ahead by providing political players with campaign contributions and other political resources in exchange for government contracts, subsidies, tax benefits, and other forms of political favoritism. • Projects of crony capitalists will often be counterproductive • Crony capitalism reflects govt. failure and undermines the legitimacy of the democratic political process.
The Economic Way of Thinking About Markets and Government • Two key points about government: • Protective function of government: When government protects private property, enforces contracts evenhandedly, maintains monetary stability, and refrains from regulations that restrict entry into markets, it provides the foundation for the smooth operation of markets. • Government failure: Both political and market organization have shortcomings.
The Economic Way of Thinking About Markets and Government • Public choice analysis shows that there is sometimes a conflict between winning elections and following sound policies. • For some types of activities, there is reason to believe that the political action that will help one get elected will, at the same time, encourage counter-productive activities that reduce income levels.
The Economic Way of Thinking About Markets and Government • Understanding the strengths and weaknesses of both sectors is important if we are going to improve our current economic institutions. • The following factors often result in market failure: • Lack of competition • Externalities • Public goods • Poor information • The following factors often result in government failure: • The special-interest effect • The shortsightedness effect • Rent-seeking • Weak incentives for operational efficiency
Questions for Thought: • “Political officials will be led as if by an invisible hand to support legislation that provides concentrated benefits to interest groups at the expense of disorganized groups such as taxpayers and consumers.” – Is this statement true or false? Why? • What is the shortsightedness effect? How does the shortsightedness effect influence the efficiency of public sector action?
Questions for Thought: 3. Why does representative democracy often tax some people in order to provide benefits to others? When governments become heavily involved in tax-transfer activities, how will this involvement affect the size of the economic pie? Explain. 4. What is rent seeking? What types of government activities encourage rent seeking?
Questions for Thought: 5. "Since government-operated firms do not have to make a profit, they can usually produce at a lower cost and charge a lower price than privately owned enterprises." – Evaluate this view. 6. The US imposes highly restrictive sugar import quotas that result in a domestic price of sugar often two or three times the world price. The quotas benefit sugar growers at the expense of consumers. Given there are far more sugar consumers than growers, why are the quotas not abolished? Do the sugar quotas improve American living standards? Why/why not?
End of Chapter 6