Download
1 / 1
10 likes | 139 Views
Backward Air Trajectories Associated with Snowfall Events in the Southern Appalachian Mountains: 2006 to 2011 Jonathan A. Welker and L. Baker Perry Department of Geography and Planning, Appalachian State University, Boone, NC. RESULTS (Continued) Composite Snowfall Totals and Characteristics

E N D
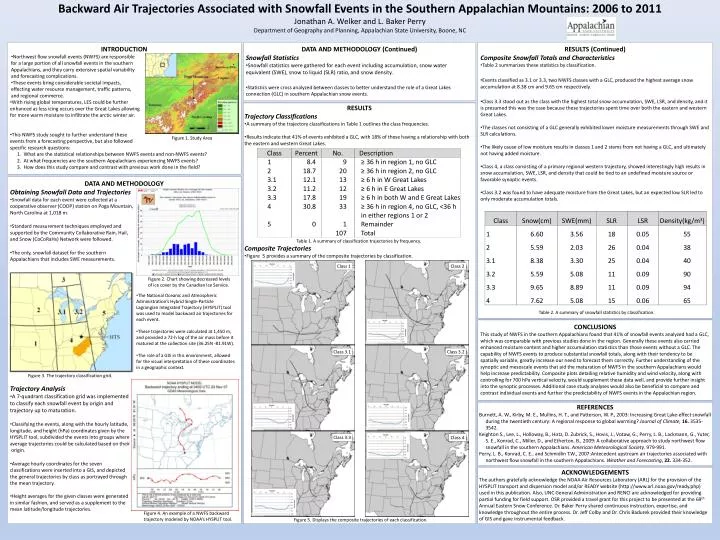
Backward Air Trajectories Associated with Snowfall Events in the Southern Appalachian Mountains: 2006 to 2011 Jonathan A. Welker and L. Baker Perry Department of Geography and Planning, Appalachian State University, Boone, NC • RESULTS (Continued) • Composite Snowfall Totals and Characteristics • Table 2 summarizes these statistics by classification. • Events classified as 3.1 or 3.3, two NWFS classes with a GLC, produced the highest average snow accumulation at 8.38 cm and 9.65 cm respectively. • Class 3.3 stood out as the class with the highest total snow accumulation, SWE, LSR, and density, and it is presumed this was the case because these trajectories spent time over both the eastern and western Great Lakes. • The classes not consisting of a GLC generally exhibited lower moisture measurements through SWE and SLR calculations. • The likely cause of low moisture results in classes 1 and 2 stems from not having a GLC, and ultimately not having added moisture. • Class 4, a class consisting of a primary regional western trajectory, showed interestingly high results in snow accumulation, SWE, LSR, and density that could be tied to an undefined moisture source or favorable synoptic events. • Class 3.2 was found to have adequate moisture from the Great Lakes, but an expected low SLR led to only moderate accumulation totals. • INTRODUCTION • Northwest flow snowfall events (NWFS) are responsible • for a large portion of all snowfall events in the southern • Appalachians, and they carry extensive spatial variability • and forecasting complications. • These events bring considerable societal impacts, • effecting water resource management, traffic patterns, • and regional commerce. • With rising global temperatures, LES could be further • enhanced as less icing occurs over the Great Lakes allowing • for more warm moisture to infiltrate the arctic winter air. • This NWFS study sought to further understand these • events from a forecasting perspective, but also followed • specific research questions: • 1. What are the statistical relationships between NWFS events and non-NWFS events? • 2. At what frequencies are the southern Appalachians experiencing NWFS events? • 3. How does this study compare and contrast with previous work done in the field? • DATA AND METHODOLOGY (Continued) • Snowfall Statistics • Snowfall statistics were gathered for each event including accumulation, snow water equivalent (SWE), snow to liquid (SLR) ratio, and snow density. • Statistics were cross analyzed between classes to better understand the role of a Great Lakes connection (GLC) in southern Appalachian snow events. • RESULTS • Trajectory Classifications • A summary of the trajectory classifications in Table 1 outlines the class frequencies. • Results indicate that 41% of events exhibited a GLC, with 18% of these having a relationship with both the eastern and western Great Lakes. • Composite Trajectories • Figure 5 provides a summary of the composite trajectories by classification. Figure 1. Study Area • DATA AND METHODOLOGY • Obtaining Snowfall Data and Trajectories • Snowfall data for each event were collected at a • cooperative observer (COOP) station on Poga Mountain, • North Carolina at 1,018 m. • Standard measurement techniques employed and • supported by the Community Collaborative Rain, Hail, • and Snow (CoCoRaHs) Network were followed. • The only, snowfall dataset for the southern • Appalachians that includes SWE measurements. • Trajectory Analysis • A 7-quadrant classification grid was implemented • to classify each snowfall event by origin and • trajectory up to maturation. • Classifying the events, along with the hourly latitude, • longitude, and height (hPa) coordinates given by the • HYSPLIT tool, subdivided the events into groups where • average trajectories could be calculated based on their • origin. • Average hourly coordinates for the seven • classifications were inserted into a GIS, and depicted • the general trajectories by class as portrayed through • the mean trajectory. • Height averages for the given classes were generated • in similar fashion, and served as a supplement to the • mean latitude/longitude trajectories. Table 1. A summary of classification trajectories by frequency. Class 1 Class 2 Figure 2. Chart showing decreased levels of ice cover by the Canadian Ice Service. • The National Oceanic and Atmospheric Administration’s Hybrid Single-Particle Lagrangian Integrated Trajectory (HYSPLIT) tool was used to model backward air trajectories for each event. • These trajectories were calculated at 1,450 m, and provided a 72-h log of the air mass before it matured at the collection site (36.25N -81.91W). • The role of a GIS in this environment, allowed for the visual interpretation of these coordinates in a geographic context. Table 2. A summary of snowfall statistics by classification. CONCLUSIONS This study of NWFS in the southern Appalachians found that 41% of snowfall events analyzed had a GLC, which was comparable with previous studies done in the region. Generally these events also carried enhanced moisture content and higher accumulation statistics than those events without a GLC. The capability of NWFS events to produce substantial snowfall totals, along with their tendency to be spatially variable, greatly increase our need to forecast them correctly. Further understanding of the synoptic and mesoscale events that aid the maturation of NWFS in the southern Appalachians would help increase predictability. Composite plots detailing relative humidity and wind velocity, along with controlling for 700 hPa vertical velocity, would supplement these data well, and provide further insight into the synoptic processes. Additional case study analyses would also be beneficial to compare and contrast individual events and further the predictability of NWFS events in the Appalachian region. Class 3.1 Class 3.2 Figure 3. The trajectory classification grid. REFERENCES Burnett, A. W., Kirby, M. E., Mullins, H. T., and Patterson, W. P., 2003: Increasing Great Lake-effect snowfall during the twentieth century: A regional response to global warming? Journal of Climate,16. 3535-3542. Keighton S., Lee, L., Holloway, B., Hotz, D. Zubrick, S., Hovis, J., Votaw, G., Perry, L. B., Lackmann, G., Yuter, S. E., Konrad, C., Miller, D., and Etherton, B., 2009: A collaborative approach to study northwest flow snowfall in the southern Appalachians. American Meteorological Society. 979-991. Perry, L. B., Konrad, C. E., and Schmidlin T.W., 2007:Antecedent upstream air trajectories associated with northwest flow snowfall in the southern Appalachians. Weather and Forecasting, 22. 334-352. Class 3.3 Class 4 ACKNOWLEDGEMENTS The authors gratefully acknowledge the NOAA Air Resources Laboratory (ARL) for the provision of the HYSPLIT transport and dispersion model and/or READY website (http://www.arl.noaa.gov/ready.php) used in this publication. Also, UNC General Administration and RENCI are acknowledged for providing partial funding for field support. OSR provided a travel grant for this project to be presented at the 69th Annual Eastern Snow Conference. Dr. Baker Perry shared continuous instruction, expertise, and knowledge throughout the entire process. Dr. Jeff Colby and Dr. Chris Badurek provided their knowledge of GIS and gave instrumental feedback. Figure 4. An example of a NWFS backward trajectory modeled by NOAA’s HYSPLIT tool. Figure 5. Displays the composite trajectories of each classification.