Download
1 / 21
210 likes | 327 Views
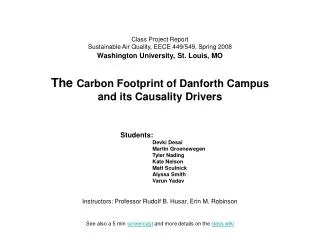
Class Project Report Sustainable Air Quality, EECE 449/549, Spring 2009 Washington University, St. Louis, MO The Energy Analysis and Carbon Footprint of the Danforth University Center and its Causality Drivers. Students: Maiko Arashiro Alex Clark Neil Feinberg Mark Henson Kerry Herr

E N D
Class Project ReportSustainable Air Quality, EECE 449/549, Spring 2009Washington University, St. Louis, MOThe Energy Analysis and Carbon Footprint of the Danforth University Centerand its Causality Drivers Students: Maiko Arashiro Alex Clark Neil FeinbergMark Henson Kerry Herr Evan Kangas Janna Lambson Michael McDonald Katie Poeltl Cameron Smith Kharel Thompson Instructors: Professor Rudolf B. Husar, Erin M. Robinson For more details see the class wiki
DUC Consumption by End-Use – OUTLINE ONLY REMOVE • Pie chart showing how much carbon is associated with each activity in the DUC • Office/Conference Rooms • Electricity • Hot Water • Chilled Water • Kitchens • Electricity • Hot Water • Chilled Water • Natural Gas • Social Common Areas • Electricity • Hot Water • Chilled Water • Cost Analysis • Carbon Footprint
Offices • Includes: • Career Center • Office of Student Activities • The Student Union • Community Service Office • Graduate Center • Management and Event Services • Total area of 35,873 ft2 • Assumed to be in operation on M-F 8:00am-6:00pm
Offices • There is a baseline of electricity usage from ventilation, cooling, and other • Lighting and equipment are assumed to be on only during office hours
Conference Space • Total area of 24,278 ft2 • Includes 12 meeting rooms • Meeting rooms locked when not in use • Requires card key to get in
Conference Space • There is a baseline of electricity consumption from cooling and ventilation
Kitchens Energy use in restaurants and industrial kitchens can be divided into 5 categories, and energy is consumed in those areas in these proportions: The energy used for “food prep” is natural gas, while the other 4 activities use electricity.
Kitchens: Weekday • Total energy peaks at the lunch rush, and dies back down when food is no longer served • Food prep, HVAC, and Sanitation are the most variable, and high energy consumers.
Kitchens: Weekend • Energy usage is much lower on the weekends than during the week. • Peaks still occur at traditional meal times, but they aren’t as high.
Use national averages by building type to estimate carbon associated with activities in the DUC
Recommendations • Office Electricity Reduction • Turn off monitors if leaving for more than 15 minutes • Turn off computers overnight if possible • Use laptops for tasks not needing a desktop • Unplug all equipment overnight • Turn off lights when leaving the room