Download
1 / 17
170 likes | 260 Views
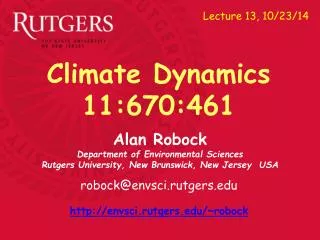
Lecture 2, 9/9/13. Climate Dynamics 11:670:461. Alan Robock Department of Environmental Sciences Rutgers University, New Brunswick, New Jersey USA. robock@envsci.rutgers.edu. http://envsci.rutgers.edu/~ robock.

E N D
Lecture 2, 9/9/13 Climate Dynamics11:670:461 Alan Robock Department of Environmental Sciences Rutgers University, New Brunswick, New Jersey USA robock@envsci.rutgers.edu http://envsci.rutgers.edu/~robock
Nitrogen (N2), oxygen (O2), and argon (Ar) make up for 99% of the atmosphere, but are not greenhouse gases. Water vapor (H2O), carbon dioxide (CO2), methane (CH4), ozone (O3), and nitrous oxide (N2O) are greenhouse gases. A greenhouse gas absorbs infrared radiation, whichcreates molecular vibrationand bending. Collisions transfer energy to heat the surrounding gas. But, what is a “greenhouse gas” anyway? Water vapor (H2O) vibration modes http://www.lsbu.ac.uk/water/vibrat.html
CCSM Climate “Forecasts” (°C) (°C) Produced by Gary Strand, NCAR
Fig. 1.1 IPCC AR4, Chapter 1
Fig. 1.2 Bretherton Diagram
Fig. 1.2 Bretherton Diagram
Troposphericaerosols mask warming(global dimming) Recovery from volcanic eruptions dominates Greenhouse gases dominate http://data.giss.nasa.gov/gistemp/graphs/Fig.A2.pdf
Desire for improved well-being Consumption of goods and services Impacts on humans and ecosystems SUFFERING CONSERVATION EFFICIENCY ADAPTATION Consumption of energy Climate change SOLAR RADIATION MANAGEMENT LOW-CARBON ENERGY CARBON DIOXIDE REMOVAL CO2 emissions CO2 in the atmosphere After Ken Caldeira
Annual average surface air pressure. Interval 50 mb. Fig. 2.1
Annual average surface air pressure. Interval 50 mb. Fig. 2.1
Annual mean900 mb geopotential height (m) Annual mean200 mb geopotential height (m) Fig. 2.3
Annual mean900 mb geopotential height (m) Annual mean200 mb geopotential height (m) Fig. 2.3