Download
1 / 36
360 likes | 487 Views
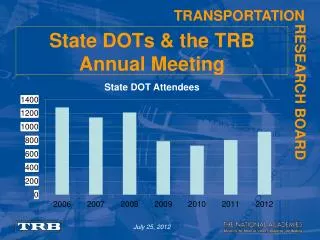
Best Practices for Signal Operations – Lessons Learned from the Portland Workshop - 2003. Peter Koonce TRB Annual Meeting January 9, 2005. Presentation Overview. Problem Statement Operational Assessment Parting Thoughts. Problem Statement: Detection Layout and Location (Design).

E N D
Best Practices for Signal Operations – Lessons Learned from the Portland Workshop - 2003 Peter Koonce TRB Annual Meeting January 9, 2005
Presentation Overview • Problem Statement • Operational Assessment • Parting Thoughts
Problem Statement:Detection Layout and Location (Design) • Briefly explain and provide (standard drawings, graphs, or spreadsheets) your detection layout approach. • Discuss methodology used to determine the number of detectors, what criteria is used?
Problem Statement:Detection Timing (Operations) • Briefly explain your approach to detector timing • Discuss the timing functions used • What are the basic parameters that are used for detection timing and what is their purpose? Volume density functions, Min Green, etc.
Future Topic Problem Statement:Define Detector Purpose • Design for Safety and/or Efficiency • Any Consideration of Timing Functions in Design Phase or vice versa?
Detector Functions and Timing (Operations) • Considering the following questions • How do different technologies change what you do? • What effect does speed changes have on your approach? • Do you change parameters depending on the operation of the intersection (isolated and coordinated or by time of day)? • How do additional through lanes (2 or more) effect your approach to timing (gap settings, dilemma zone)? • How much does the public effect what you do and what effect exists? • Do you use detector timing features and contrast that with controller timing features?
Problem with the Traditional Approach • One size fits most! • Signal design phase may not consider actual operations (or vice versa) • Session 1 – Design • Consider layout and placement of detectors • Session 2 – Timing • Consider operations of the signal controller Innovative Notion: It is an Iterative Process
No consensus Are the detection needs different at…..? • Type of conditions • Urban conditions • Rural conditions – high speed, mostly uncoordinated/fully actuated • Time of day • P.M. Peak vs. Middle of night • Coordinated vs. Uncoordinated • High-speed (>35 mph) conditions • High-speed coordinated
Practices of Signal Timing – New ITE Report “The vehicle extension interval is one of the most important actuated controller settings. Here again, diverse techniques are used to select values. The techniques reported include: • field evaluation, • speed and volume, • loop detector location, • Single standard value, • Fixed value, (2, 3, 3.5, and 7 sec were reported), • Length of detection zone, • Time for vehicles to cross intersection (minus 4 s), and • Time required for slow moving vehicle to pass over loops”
Graphical Representation of Vehicle Control Logic • Two separate cases from a signal control strategy and how it affects detection on a phase
Purpose of Detection in Uncoordinated Operation • In high-speed uncoordinated operation, detection settings should not max green (for safety) • For efficiency, max greens or detection should keep phase time reasonable
Graphical Representation of Vehicle Control Logic • Non-coordinated phase or side street ends with: • max green or • Forceoff/split end ** Efficiency under safety • Safety is maintained if you find a gap
Graphical Representation of Vehicle Control Logic • Coordinated phase • No dilemma zone possible without actuated coord phase ** Efficiency over safety?
End Phase No Dilemma Zone Graphical Representation of Vehicle Control Logic 1 2 3 4
Suggested Detection PlacementCity of Portland Method • Graphical method using safe stopping distance to determine appropriate location of detectors • Identify speed and distance relationship to provide yellow as vehicle reaches the stop bar (approximately 5-10 feet within) • Largest gap setting is 2.5 seconds to insure efficiency • Use of presence mode for all detectors
Detection Design and Timing Philosophy • If vehicle actuates the first advance loop, try to get it through the intersection • Use progressive loops to determine whether vehicles can stop safely in advance of the intersection • Use additional loops to minimize gap time • Display the yellow as vehicle enters the intersection (25 to 40 feet from stop bar at full speed)
City of Portland Detection Placement 0. Front loop standard is 60 feet because safe stopping distance essentially ends at speeds below 15 mph • Identify speed of facility and site first detector at safe stopping distance using curve • Once vehicle leaves the back loop (back of vehicle), project vehicle path to standard front loop (at 60 feet) using the safe stopping distance speed (25 fps) from front loop • Determine carryover by checking what minimum gap setting is at front detector
Detector Location based on SSD - 35 mph casePlace Upstream Detection for Safety • Speed in this case is 35 mph, thus place back loop at 183’
Detector Location based on SSD - 35 mph caseDetermine whether additional detectors are needed 4.2 sec • Vehicle moves from 167’ to next loop at 60’ – would require 4.2 sec at 25 feet per second (25 fps is SSD from detector at 60’) – use intermediate loop at 1.5 sec from upstream Use a third detector to reduce gap setting
Detector Location based on SSD - 35 mph caseAdditional detector for snappy timing • Split difference between first two detectors Vehicle moves from 167’ to next loop at 115’ – would require 1.5 sec at 36 feet per second – repeat for third loop
Detector Timing based on SSD - 35 mph caseAdditional detector for snappy timing • Vehicle moves from 100’ to next loop at 60’ – would require 1.5 sec at 26 feet per second Gap settings are very low, maintains efficiency
Detector Timing based on SSD - 35 mph caseFinal Design • Determine carryover by checking what minimum gap setting is at front detector Vehicle trajectory carries vehicle through intersection at safe stopping distance - 0.5 seconds is minimum gap at front loop, carryover is 1.5 – 0.5 = 1.0 secs
Concept of Carryover • Carryover defines the amount of time a call stays active after the vehicle has left the detector • Portland uses this to reduce the gap time in the controller and maintain flow rates • In this example, carryover is applied to back loops Gap Setting + Carryover 1.0 s + 0.5 s = 1.5 s Gap Setting 0.5 s
Detector locations: 182’, 118’, and 60’Min Gap 0.5 sec, per City standard Carryover from Back loops 1.0 sec Detector Timing and Design - 35 mph caseFinal Design
Dilemma Zone Loop Placement(ODOT Method) Source: ODOT
Detector Timing based on DOT method - 35 mph In this 35 mph design case with detectors at 220’ and 110’ there are two checks The SSD is 37 mph from the advance and 24 mph from the front loops A car leaving from upstream detector travels 110’- (3’ loop + 15’ car length) = 92’ from stop bar At 24 mph or 36 fps, the gap setting is 2.5 seconds
WSDOT Loop Detection • Additional loops if gap setting is greater than 3 seconds
Operational Assessment • A 2.5 second gap compared to a 1.5 second gap • Losing one second every phase, four “phases” every cycle • What is the flow rate that will keep a phase operational? • On a 3-lane roadway: See example • On a 5-lane roadway • On a 7-lane roadway
Back to the ODOT 35 mph design case: At 35 mph (51 fps) a vehicle will reach the first detector (nose of vehicle @223’) and travel to over the second detector (@92’) – 131’ at 51 fps = 2.6 seconds + additional gap of 2.5 seconds Gap Setting on Detector 2.5 s Travel Time to Next Detector 2.6 s Interval between successive vehicles – 5.1 seconds Worst case flow rate: 706 vehicles per hour 37% of what is ideal saturation flow rate
Let’s try the PDOT 35 mph design case: At 35 mph (51 fps) a vehicle will reach the first detector (@183’) and travel over the final detector (@42’) – 141’ at 51 fps = 2.7 seconds Gap Setting on Last Detector 0.5 s Travel Time to Last Detector 2.7 s Interval between successive vehicles – 3.2 seconds Worst case flow rate: 1,125 vehicles per hour 59% of what is ideal saturation flow rate
No Advance Loop Placement • Proper use of gap timing settings to offer • Efficient performance? • Safety? • Assume little safety benefit with stop bar detection only
Observations from the Field • Poor gap setting leads to inefficiencies at the intersections, which suggest higher cycle lengths are needed • HCM analyses assume saturation flow in all available lanes in theoretical calculations • Does not occur in reality with sloppy gap timing • Do we need different gap timing under congested conditions? • Do we need different gap timing to meet different objectives?
Questions from a Practitioner • Are safety benefits possible with detector and timing design? • What is the importance of lane by lane detection? • Is dilemma zone over multiple lanes a good idea? • What maintenance issues need to be addressed? • How do we communicate this to the practitioner?
Research Needs • Quantify the operational benefits of an additional detector(s) and lower gap settings • Assess effects on performance under fully actuated conditions (of 5- & 7-lane cross section) • Quantify the benefits of advance detection settings • Consider use of a check-out detector at intersection for improving performance