Download
1 / 25
260 likes | 458 Views
THE STRUCTURE OF INTEREST RATES Interest Rate Changes & Differences Between Interest Rates Can Be Explained by Several Variables. Term to Maturity. Default Risk. Tax Treatment. Marketability. Call or Put Features. Convertibility. Selected Rates of Interest, January 1998.

E N D
THE STRUCTURE OF INTEREST RATES Interest Rate Changes & Differences Between Interest Rates Can Be Explained by Several Variables • Term to Maturity. • Default Risk. • Tax Treatment. • Marketability. • Call or Put Features. • Convertibility.
Selected Rates of Interest,January 1998 Notice that the U.S. Treasury rate is the lowest interest rate in the economy for comparable maturities. FINANCIAL SECURITY INTEREST RATE (%) Commercial Paper, 3 months 4.77 Finance company paper, 3 months 4.81 Banker’s Acceptance, 3 months 4.80 U.S. Government Securities: 3-month Treasury bills 4.45 12-month Treasury bills 4.51 5-year Treasury notes 4.60 10-year Treasury bonds 4.72 Aaa municipals (state and local obligations) 5.02 Aaa corporate bonds 6.24 Aa corporate bonds 6.68 A corporate bonds 6.84 Baa corporate bonds 7.29 Source: Federal Reserve statistical release G.13 and Moody’s Investor Services.
Term (Maturity) Structure May Be Studied Visually by Plotting a Yield Curve at a Point in Time • The yield curve may be ascending, flat, or descending. • Several theories explain the shape of the yield curve.
Yield Curves on Treasury Securities in the 1980’s and 1990’s
The Expectations Theory - Interest Rate Expectations Shape the Yield Curve • The slope of the yield curve reflects investors’ expectations about future interest rates. • Ascending: future interest rates are expected to increase. • Descending: future interest rates are expected to decrease. • Long-term interest rates represent the geometric average of current and expected future (implied, forward) interest rates. • Investors are assumed to trade in a very efficient market with excellent information and minimal trading costs. Other theories discussed later presume less efficient markets.
Term Structure Formula from Expectation Theory An Implied One Year Forward Rate from the Term Structure Formula
Finding a One-Year Implied Forward Rate • Using term structure of interest rates from January 29, 1999, find the one-year implied forward rate for year three. • 1-year Treasury bill 4.51% • 2-year Treasury note 4.58% • 3-year Treasury note 4.57%
Liquidity Premium Theory • Long-term securities have greater risk and investors require greater premiums to give up liquidity. • Long-term securities have greater price variability. • Long-term securities have less marketability. • The liquidity premium explains an upward sloping yield curve.
Market Segmentation Theory- Maturity preferences may affect security prices (yields), explaining variations in yields by time • Market participants have strong preferences for securities of particular maturity and buy and sell securities consistent with their maturity preferences. • If market participants do not trade outside their maturity preferences, then discontinuities are possible in the yield curve. Preferred Habitat Theory • The Preferred Habitat Theory is an extension of the Market Segmentation Theory. • The Preferred Habitat Theory allows market participants to trade outside of their preferred maturity if adequately compensated for the additional risk. • The Preferred Habitat Theory allows for humps or twists in the yield curve, but limits the discontinuities possible under Segmentation Theory.
Which Theory is Right? • Day-to-day changes in the term structure are most consistent with the Preferred Habitat Theory. • However, in the long-run, expectations of future interest rates and liquidity premiums are important components of the position and shape of the yield curve.
Yield Curves and the Business Cycle • Interest rates are directly related to the level of economic activity. • An ascending yield curve notes the market expectations of economic expansion and/or inflation. • A descending yield curve forecasts lower rates possibly related to slower economic growth or lower inflation rates. • Security markets respond to updated new information and expectations and reflect their reactions in security prices and yields.
Interest-Rate and Yield-Curve Patterns Over the Business Cycle
Default Risk Is the Probability of the DSU Not Honoring the Security Contract • Losses may range from “interest a few days late” to a complete loss of principal. • Risk averse investors want adequate compensation for expected default losses.
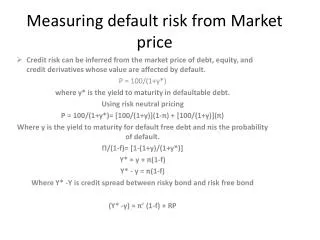
Investors Charge a Default Risk Premium (Above Riskless or Less Risky Securities) for Added Risk Assumed • DRP = i - irf • The default risk premium (DRP) is the difference between the promised or nominal rate and the yield on a comparable (same term) riskless security (Treasury security). • Investors are satisfied if the default risk premium is equal to the expected default loss.
Risk Premiums for Selected Securities (January 1999) Notice that as bond rating quality declines, the default risk premium increases. SECURITY YIELD EQUIVALENT RISK-FREE RATEa RISK PREMIUM SECURITY (PERCENT) (PERCENT) (PERCENT) Corporate bonds: Aaa 6.24 5.16 1.08 Corporate bonds: Aa 6.68 5.16 1.52 Corporate bonds: A 6.84 5.16 1.68 Corporate bonds: Baa 7.29 5.16 2.13 aThirty-year Treasury bond yield. Source: Moody’s Investor Services, January, 1999.
Default Risk Premiums Increase (Widen) in Periods of Recession and Decrease in Economic Expansion • In good times, risky security prices are bid up; yields move nearer that of riskless securities. • With increased economic pessimism, investors sell risky securities and buy “quality” widening the DRP.
Credit Rating Agencies Measure and Grade Relative Default Risk Among DSUs and Their Securities • Cash flow, level of debt, profitability, and variability of earnings are indicators of default riskiness. • As conditions change, rating agencies alter rating of businesses and governmental debtors.
The Taxation of Security Gains and Income Affects the Yield Differences Among Securities • The after-tax return, iat, is found by multiplying the pre-tax return by one minus the marginal tax rate. iat = ibt(1-t) • Municipal bond interest income is tax exempt. • Coupon income and capital gains have been taxed differently in the past, but are now both taxed at the same rate as ordinary income.
Should You Buy a Municipal or a Corporate Bond? CORPORATE AFTER-TAX INVESTORS’ MARGINAL TAX RATE MUNICIPAL YIELD YIELD 0% 7% 10(1 - 0.00) = 10.0% 10 7 10(1 - 0.10) = 9.0 20 7 10(1 - 0.20) = 8.0 30 7 10(1 - 0.30) = 7.0 40 7 10(1 - 0.40) = 6.0 50 7 10(1 - 0.50) = 5.0
Differences in Marketability Affect Interest Yields • Marketability -- The costs and rapidity with which investors can resell a security. • Cost of trade. • Physical transfer cost. • Search costs. • Information costs. • Securities with good marketability have higher prices (in demand) and lower yields.
Varied Option Provisions May Explain Yield Differences Between Securities • An option is a contract provision which gives the holder the right, but not the obligation, to buy,sell, redeem, or convert an asset at some specified price within a defined future time period.
A Call Option Permits the Issuer (Borrower) to Call (Refund) the Obligation Before Maturity • Borrowers will “call” if interest rates decline. • Investors in callable securities bear the risk of losing their high-yielding security. • With increased call risk, investors demand a call interest premium (CIP). • CIP = ic - inc • A callable bond, ic, will be priced to yield a higher return (by the CIP) than a noncallable, inc, bond.
A Put Option Permits the Investor (Lender) to Terminate the Contract at a Designated Price Before Maturity • Investors are likely to “put” their security or loan back to the borrower during periods of increasing interest rates. The difference in interest rates between putable and nonputable contracts is called the put interest discount (PID). • PID = ip - inp • The yield on a putable bond, ip, will be lower than the yield on the nonputable bond, inp, by the PIP.
A Conversion Option Permits the Investor to Convert a Security Contract Into Another Security • Convertible bonds generally have lower yields, icon, than nonconvertibles, incon. • The conversion yield discount (CYD) is the difference between the yields on convertibles relative to nonconvertibles. • CYD = icon - incon. Investors accept the lower yield on convertible bonds because they have an opportunity for increased rates of return through conversion.