Download
1 / 10
100 likes | 277 Views
Grafiek 1 BBP-groei Nederland 2008 K1 = 100 en procentuele mutaties kwartaal op kwartaal. Bron: CBS en DNB. Grafiek 2 Bronnen van bbp -groei Nederland Procentuele mutaties en procentpunten.

E N D
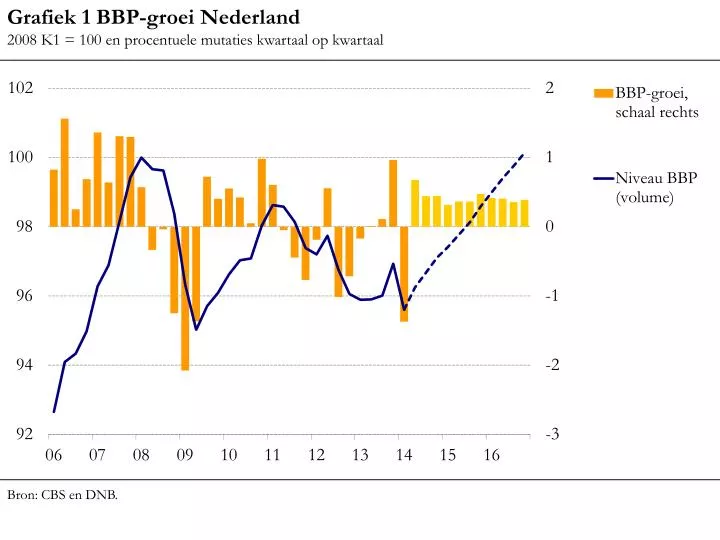
Grafiek 1 BBP-groei Nederland 2008 K1 = 100 en procentuele mutaties kwartaal op kwartaal Bron: CBS en DNB.
Grafiek 2 Bronnen van bbp-groei Nederland Procentuele mutaties en procentpunten Toelichting: Netto bijdragen aan bbp-groei, waarbij de finale en gecumuleerde intermediaire invoer in mindering zijn gebracht op de bijbehorende afzetcategorieën. Bron: CBS en DNB.
Grafiek 3 Bijdrage delfstoffenwinning aan bbp-groei Procentpunten en procentuele mutaties kwartaal op kwartaal Toelichting: De post overig is inclusief een statistisch verschil. Bron: CBS.
Grafiek 4Arbeidsmarkt en inflatie Procenten beroepsbevolking en procentuele mutaties jaar op jaar Bron: CBS, DNB en Eurostat.
Grafiek 5 Inflatie (HICP) in Nederland Procentuele mutaties en bijdragen (procentpunten) Bron: CBS, DNB en Eurostat.
Grafiek 6 Marktaandeel uitvoer goederen en diensten Index 2008 = 100 en verschil in procentuele mutaties; volume Toelichting: Index is desbetreffende categorie gedeeld door relevante wereldhandel. Binnenslands geproduceerd is exclusief energie. Bron: CBS, CPB, DNB en ECB.
Grafiek 7 Reëel beschikbaar gezinsinkomen Groei (procenten) en bijdragen (procentpunten) Toelichting: De hoogte van elk gekleurd deel in een kolom geeft de bijdrage van een inkomenscomponent aan de groei van het totaal. Inflatie is gebaseerd op de particuliere consumptiedeflator. Bron: CBS en DNB.
Grafiek 8 Individuele en collectieve besparingen Procenten beschikbaar inkomen¹ 1. Inclusief correctie pensioenvoorziening. Bron: CBS en DNB.
Grafiek 9 Huizenprijzen Procentuele mutaties Bron: CBS, Kadaster en DNB.
Grafiek 10 Uitvoer naar Russische federatie Procentuele mutaties jaar op jaar; waarde Bron: CBS.