Download
1 / 40
400 likes | 409 Views
JASS 2005 Management Course. St. Petersburg April 2-April 5, 2005 Helmuth Benesch Siemens AG Corporate Technology Software and Engineering Otto-Hahn-Ring 6 81739 München – Germany phone: ++49 89 636-46666 fax: ++49 89 636-44424 helmuth.benesch@siemens.com. JASS 2005 Management Course.

E N D
JASS 2005 Management Course St. Petersburg April 2-April 5, 2005 Helmuth Benesch Siemens AG Corporate TechnologySoftware and Engineering Otto-Hahn-Ring 681739 München – Germanyphone: ++49 89 636-46666fax: ++49 89 636-44424helmuth.benesch@siemens.com
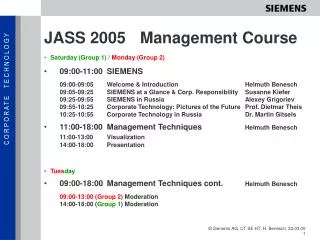
JASS 2005 Management Course • Management Techniques • Visualization • Presentation • Moderation
Visualization • Goals • Fundamentals • Key Questions • Media and Design Elements • Arrangement and Logic • Preparing the Content
Goals • to focus the receivers‘ attention, • to involve observers, • to lessen the amount of speaking required, • to give the audience orientation aids, • to make information easy (or easier) to grasp, • to emphasize crucial points, • to expand on and supplement what has been said, • to promote assimilation, • to encourage comments
Fundamentals … planning a visualization, … building blocks of a visualization, … rules for composing a visualization
Key Questions • What do I want to represent? (content) • What is the purpose of the presentation? (goal) • Whom do I want to inform or convince? (target group)
Media & Design Elements Media • packing paper and pin board • flip chart paper and flip chart stands • transparent foil and overhead projector • power point and beamer Design Elements • text • free-style graphics and symbols • diagrams
Design Element „Text“ Legibility write legibly adhere to reading conventions Intelligibility (clarity, clearness) simplicity outline / order brevity / conciseness additional stimulae
Design Element „Free-style Graphics“
Design Element „Standard Symbols“ $ € %
Design Element „Non-standard Symbols“
Design Element „Diagrams“ • lists and tables • graphs • column charts • circle or pie diagrams • structure charts / “organigrams” • flow charts / arrow diagrams
Nr. 1 2 3 4 5 6 7 8 9 10 11 Required Interfaces Monitor Terminal Monitor Administration routine Monitor Partner computerDCM DCAMAdministration routine User program Transmit routine User program Transmit routine Receive routine Receive routine Rec. Control UnitRec.Control Unit User program Test program Terminal EDT Proc. Terminal Weight 1.5 1.5 2.0 0.5 1.0 0.5 0.8 0.6 0.3 1.0 0.5 Efforts 17.25 MD 17.25 MD 23.00 MD 5.75 MD 11.50 MD 5.75 MD 9.20 MD 6.90 MD 3.45 MD 11.50 MD 5.75 MD S Interface Efforts 118 MD Design Element „Lists and Tables“
1990 1991 1992 IV I II III IV I II III IV I I IV 1992 III II I IV III 1991 II I 1990 Design Element „Graph“
Design Element „Column Chart“
Initiative Acceptance Study 3 % 3 % 7 % 13 % Project Planning 29 % System Integrationand Testing 20 % Design 25 % Implementation Development Costs per Phase Design Element „Circle or Pie Diagram“
Design Element „Structure Chart“
Design Element Component Code „Flow Chart“ ComponentSpecification ComponentDescription DesignSpecification ComponentTest TestSpecification TestData
Arrangement & Logic • symmetry • alignment • rhythm • dynamics
Tips on Designing Posters • Whenever possible use no more than three colors per representation! • Create blocks; group contextual units (also) by displaying them in close proximity to one another! • Always use the same color and shape for related subjects! • Stress important parts, for instance by using red or by using a frame, underlining or cross-hatching! • (Also) use empty spaces as a design element; leave plenty of open space! • Don’t use abbreviations – write everything out! • Use the stimulating effect of free-style graphics; paint a “picture” of your own! • Whatever you do, avoid perfect representations; images that are too “smooth” seem cold and create distance! • Test your visualization (!) by presenting it to friends or colleagues, and ask them for their opinions!
Presentation • Preparing for the topic and the goal • Preparing for the target group • Preparing the content • Preparing the flow • Preparing the organization • Just Do the presentation
A thorough preparation leads to • more information, knowledge of details • more personal clarity • the possibility of well-aimed visualization • the chance for a smoothly organized flow of events • the availability of materials as needed • ultimately, greater self-confidence in making your appearance
What belongs to a meaningful preparation? • topic • goal • target group • content • flow of events • organization
Preparing for the Topic and the Goal • Topic and goal should not be mixed up • The emphasis lies on the goal Topic: Spring retreat of department X Goal: Roadmap for department X dig for hidden goals
Preparing for the Target Group • predefined participantshere is a number of interested people what is my solution • selection of participantsI have a solution who are the interested people
Preparing the content • Gather and select material • Condense • Visualize
Preparing for the Flow of the Presentation 1. Opening Remarks 2. Main Body 3. Conclusion
Prepare the Presentation • Location / Room • Media • Time / Duration /Breaks • Invitation • Handouts for the Participants • Speaker / Substitute
Conducting a Presentation Opening- appearance- positive thinking- punctuality Main Body- overview (content & time)- results – but not the flow of the discussion- use your voice- short sentences Conclusion- brief summary / conclusion- avoid phrases like „that‘s it“- thank the participants
After the Presentation Self-Feedback - Goal - Participants - Organization - Media - Discussion Feedback from the participants - Giving feedback - Receiving feedback - Accepting feedback
Moderation • Before • During • After
Before the Moderation Prepare in terms of • content - goal - participants • method - collect - select - work • organization - time/date - location - arrangement - media - invitation • personal - physical constitution - mental constitution
Performing a Moderation Conclusion Plan Measures Work on a Topic Select a Topic Collect Topics Introduction
Moderator = Facilitator Attributes and Attitudes • don‘t fight against the group • work in accordance with a certain methodology • act as an expert on method, not on content (stay neutral) • include all participants • create a positive working environment • disruptions have priority • cut off, neutralize personal attacks • keep control of the process - time - focus - group
After the Moderation • Feedback • Tasks • Next Steps
Finale • Thank you very much for your attention • Questions ? • Comments? • Feedback? • Personal conclusion?