Download
1 / 1
10 likes | 182 Views
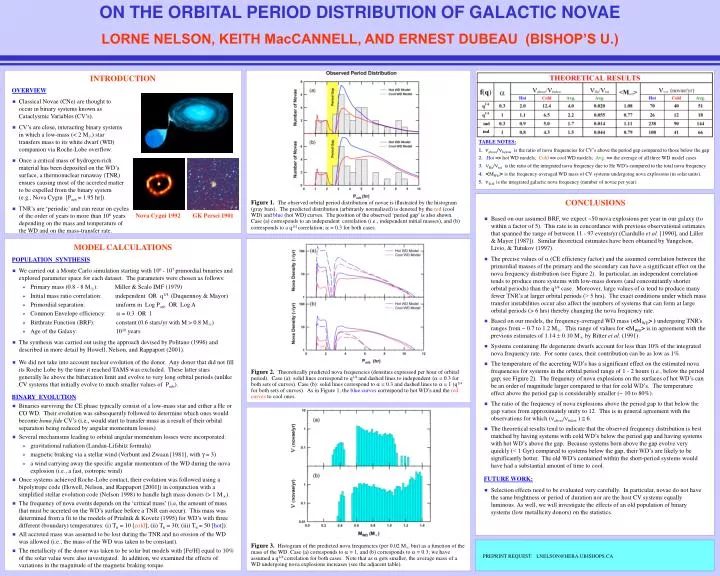
ON THE ORBITAL PERIOD DISTRIBUTION OF GALACTIC NOVAE LORNE NELSON, KEITH MacCANNELL, AND ERNEST DUBEAU (BISHOP’S U.). INTRODUCTION OVERVIEW Classical Novae (CNe) are thought to occur in binary systems known as Cataclysmic Variables (CV’s). CV’s are close, interacting binary systems

E N D
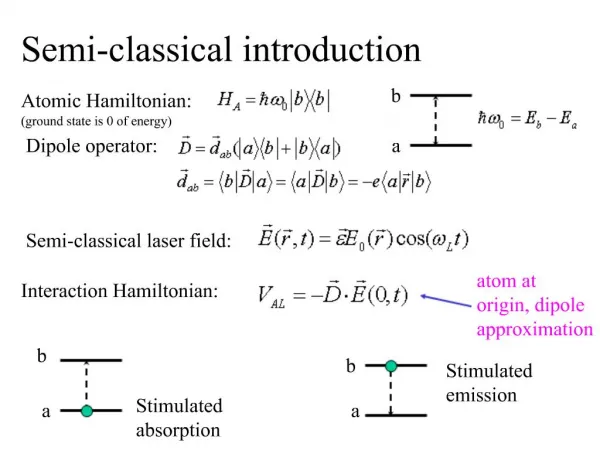
ON THE ORBITAL PERIOD DISTRIBUTION OF GALACTIC NOVAE LORNE NELSON, KEITH MacCANNELL, AND ERNEST DUBEAU (BISHOP’S U.) • INTRODUCTION • OVERVIEW • Classical Novae (CNe) are thought to occur in binary systems known as Cataclysmic Variables (CV’s). • CV’s are close, interacting binary systems in which a low-mass (< 2 M8) star transfers mass to its white dwarf (WD) companion via Roche-Lobe overflow. • Once a critical mass of hydrogen-rich material has been deposited on the WD’s surface, a thermonuclear runaway (TNR) ensues causing most of the accreted matter to be expelled from the binary system (e.g., Nova Cygni [Porb = 1.95 hr]). • TNR’s are ‘periodic’ and can recur on cycles of the order of years to more than 106 years depending on the mass and temperature of the WD and on the mass-transfer rate. ind ind TABLE NOTES: 1. above/belowis the ratio of nova frequencies for CV’s above the period gap compared to those below the gap 2.Hot=> hot WD models; Cold=> cool WD models; Avg.=> the average of all three WD model cases 3. He/totis the ratio of the integrated nova frequency due to He WD’s compared to the total nova frequency 4. <MWD> is the frequency-averaged WD mass of CV systems undergoing nova explosions (in solar units). 5.TOTis the integrated galactic nova frequency (number of novae per year) • CONCLUSIONS • Based on our assumed BRF, we expect ~50 nova explosions per year in our galaxy (to within a factor of 5). This rate is in concordance with previous observational estimates that spanned the range of between 11 - 97 events/yr (Ciardullo et al. [1990], and Liller & Mayer [1987]). Similar theoretical estimates have been obtained by Yungelson, Livio, & Tutukov (1997). • The precise values of (CE efficiency factor) and the assumed correlation between the primordial masses of the primary and the secondary can have a significant effect on the nova frequency distribution (see Figure 2). In particular, an independent correlation tends to produce more systems with low-mass donors (and concomitantly shorter orbital periods) than the q1/4 case. Moreover, large values of tend to produce many fewer TNR’s at larger orbital periods (> 5 hrs). The exact conditions under which mass transfer instabilities occur also affect the numbers of systems that can form at large orbital periods (> 6 hrs) thereby changing the nova frequency rate. • Based on our models, the frequency-averaged WD mass (<MWD> ) undergoing TNR's ranges from ~ 0.7 to 1.2 M8. This range of values for <MWD> is in agreement with the previous estimates of 1.14 0.10 M8 by Ritter et al. (1991). • Systems containing He degenerate dwarfs account for less than 10% of the integrated nova frequency rate. For some cases, their contribution can be as low as 1%. • The temperature of the accreting WD’s has a significant effect on the estimated nova frequencies for systems in the orbital period range of 1 - 2 hours (i.e., below the period gap; see Figure 2). The frequency of nova explosions on the surfaces of hot WD’s can be an order of magnitude larger compared to that for cold WD’s. The temperature effect above the period gap is considerably smaller (~ 10 to 80%). • The ratio of the frequency of nova explosions above the period gap to that below the gap varies from approximately unity to 12. This is in general agreement with the observations for which (above/below) 6. • The theoretical results tend to indicate that the observed frequency distribution is best matched by having systems with cold WD’s below the period gap and having systems with hot WD’s above the gap. Because systems born above the gap evolve very quickly (< 1 Gyr) compared to systems below the gap, their WD’s are likely to be significantly hotter. The old WD’s contained within the short-period systems would have had a substantial amount of time to cool. • FUTURE WORK: • Selection effects need to be evaluated very carefully. In particular, novae do not have the same brightness or period of duration nor are the host CV systems equally luminous. As well, we will investigate the effects of an old population of binary systems (low metallicity donors) on the statistics. Figure 1.The observed orbital period distribution of novae is illustrated by the histogram (gray bars). The predicted distribution (arbitrarily normalized) is denoted by the red (cool WD) and blue (hot WD) curves. The position of the observed ‘period gap’ is also shown. Case (a) corresponds to an independent correlation (i.e., independent initial masses), and (b) corresponds to a q1/4 correlation; = 0.3 for both cases. Nova Cygni 1992 GK Persei 1901 • MODEL CALCULATIONS POPULATION SYNTHESIS • We carried out a Monte Carlo simulation starting with 106 - 107 primordial binaries and explored parameter space for each dataset. The parameters were chosen as follows: • Primary mass (0.8 - 8 M8): Miller & Scalo IMF (1979) • Initial mass ratio correlation: independent OR q1/4 (Duquennoy & Mayor) • Primordial separation: uniform in Log Porb OR Log A • Common Envelope efficiency: = 0.3 OR 1 • Birthrate Function (BRF): constant (0.6 stars/yr with M > 0.8 M8) • Age of the Galaxy: 1010 years • The synthesis was carried out using the approach devised by Politano (1996) and described in more detail by Howell, Nelson, and Rappaport (2001). • We did not take into account nuclear evolution of the donor. Any donor that did not fill its Roche Lobe by the time it reached TAMS was excluded. These latter stars generally lie above the bifurcation limit and evolve to very long orbital periods (unlike CV systems that initially evolve to much smaller values of Porb). • BINARY EVOLUTION • Binaries surviving the CE phase typically consist of a low-mass star and either a He or CO WD. Their evolution was subsequently followed to determine which ones would become bona fide CV’s (i.e., would start to transfer mass as a result of their orbital separation being reduced by angular momentum losses). • Several mechanisms leading to orbital angular momentum losses were incorporated: • gravitational radiation (Landau-Lifshitz formula) • magnetic braking via a stellar wind (Verbunt and Zwaan [1981], with = 3) • a wind carrying away the specific angular momentum of the WD during the nova explosion (i.e., a fast, isotropic wind) • Once systems achieved Roche-Lobe contact, their evolution was followed using a bipolytrope code (Howell, Nelson, and Rappaport [2001]) in conjunction with a simplified stellar evolution code (Nelson 1998) to handle high mass donors (> 1 M8). • The frequency of nova events depends on the ‘critical mass’ (i.e, the amount of mass that must be accreted on the WD’s surface before a TNR can occur). This mass was determined from a fit to the models of Prialnik & Kovetz (1995) for WD’s with three different (boundary) temperatures: (i) T6 = 10 [cold]; (ii) T6 = 30; (iii) T6 = 50 [hot]). • All accreted mass was assumed to be lost during the TNR and no erosion of the WD was allowed (i.e., the mass of the WD was taken to be constant). • The metallicity of the donor was taken to be solar but models with [Fe/H] equal to 10% of the solar value were also investigated. In addition, we examined the effects of variations in the magnitude of the magnetic braking torque. Figure 2. Theoretically predicted nova frequencies (densities expressed per hour of orbital period). Case (a): solid lines correspond to q1/4 and dashed lines to independent( = 0.3 for both sets of curves). Case (b): solid lines correspond to = 0.3 and dashed lines to = 1 (q1/4 for both sets of curves). As in Figure 1, the blue curves correspond to hot WD’s and the red curves to cool ones. PREPRINT REQUEST: LNELSON@HERA.UBISHOPS.CA Figure 3.Histogram of the predicted nova frequencies (per 0.02 M8 bin) as a function of the mass of the WD. Case (a) corresponds to = 1, and (b) corresponds to = 0.3; we have assumed a q1/4 correlation for both cases. Note that as gets smaller, the average mass of a WD undergoing nova explosions increases (see the adjacent table).