Download
1 / 36
370 likes | 594 Views
Coastal Flood Mapping Using Customized GIS Layers. by Jeff Zanotti. National Flood Insurance Program. NFIP established in 1968 Community participation is voluntary Participation allows for chance to buy federal flood insurance in exchange for community floodplain management regulations

E N D
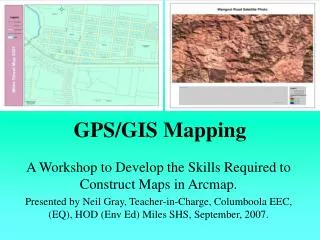
Coastal Flood Mapping Using Customized GIS Layers by Jeff Zanotti
National Flood Insurance Program • NFIP established in 1968 • Community participation is voluntary • Participation allows for chance to buy federal flood insurance in exchange for community floodplain management regulations • Buildings constructed in compliance with NFIP standards suffer around 80% less damage annually • Over 350 communities in Alabama participate
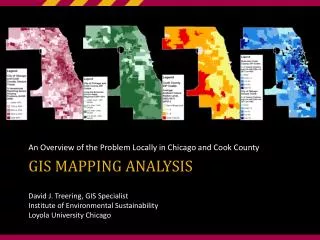
Map Modernization Majority of Flood Insurance Rate Maps (FIRMs) have become outdated in Alabama FEMA assumes primary ownership of creation of the new flood maps with Alabama’s Office of Water Resources (OWR) being responsible for the Alabama Flood Map Modernization Program “The mission of the program is to make Alabama and its citizens less vulnerable to the impact of flooding through statewide floodplain management and provide local communities with the tools and resources for managing, assessing and planning for development in flood prone areas to reduce the loss of life and property”
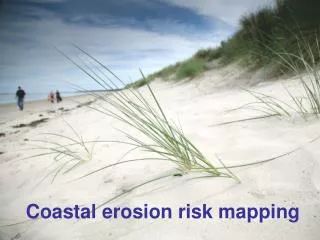
Coastal Issues • Storm surge plays an important role in controlling flooding along the coast • Unlike riverine flooding, coastal flooding also takes into account the impact of waves in designated special flood hazard areas • The impact of waves can be affected by numerous variables: sand dunes, barrier islands, type of vegetation, buildings, etc
AMEC Tool AMEC created a tool that would efficiently and accurately take into account those variables while modeling Developed using VB.NET Works as a toolbar within ESRI’s ArcGIS Desktop 9.3 Utilizes WHAFIS 4.0 and RUNUP 2.0 which are required to be installed on the computer running the Coastal Tool Requires a combination of customized GIS layers
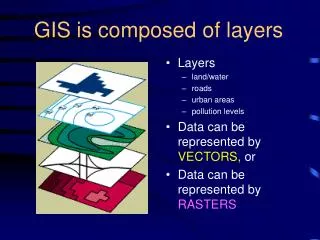
GIS Layers • Transects • Survey Points • PFD Crest • PFD Heel • Buildings • Vegetation • Surface DEM • Surge DEM • Over Water Fetch
Transects • Polylines that run from the body of water inland • Drawn from scratch in GIS by engineers and water resource specialists • Similar to cross sections in riverine studies • Evenly spaced throughout the entire study area
Survey Points • Point survey data containing ground elevation • Also can be coded for toe, peak, and heel of dune • Points are taken along transects • This layer is optional dependent upon the quality of the surface DEM
PFD Crest and PFD Heel • Polylines of the primary frontal dune’s crest and heel • These will not always be used as not all coastal areas have dunes • Assist in profiling the level of dune erosion and whether or not that will affect wave impact • These lines can be constructed using survey, obtained from data of local gov’t, or made from high resolution Lidar
Buildings • Polygons of buildings digitized from aerial imagery • Not individual buildings; groups of buildings with similar attributes (i.e. width, layout, spacing, etc) • Calculations are made or estimated (based on quality of aerial and size of the structures) to assess the “open space ratio” of each polygon
Buildings (continued) • Calculations involving row width and building width are done in GIS and reflective to properties perpendicular to the coast line • Polygons must be a certain length, dependent upon the spacing of the transects in that area • Google Street View and in field data collection allowed for the percentage of houses on stilts to be taken into account
Vegetation • Polygons representing areas of similar vegetation type • These polygons were determined by using a combination of online datasets from gov’t agencies, remote sensing data, and aerial photography • Data had to be put into a format that WHAFIS could read
Vegetation - Reclassification • Land use reclassification values • Marsh Vegetation • Herbaceous Wetlands • Rigid Vegetation • Deciduous Forest • Evergreen Forest • Mixed Forest • Woody Wetland • Shrubland • Other • Agriculture • Barren • Urban
Vegetation - GAP • GAP national land cover data was used as a helpful tool in reclassifying land use into WHAFIS accepted values • Pixel resolution was too low to be able to use in its current • Digitization had to be done to make smoother polygons that more effectively matched aerial photography
Vegetation - FIA • From WHAFIS model input parameters similar plant characteristics included: • Drag coefficient • Mean wetted height • Mean effective diameter • Mean horizontal spacing • Spatial join with Forest Inventory and Analysis (FIA) data was performed on the reclassified polygons to get a representation average for each of the sub groups
Vegetation – Marsh Grass • WHAFIS input model incorporates information based on marsh grass type • 2 main marsh grass types on the Alabama coast • Spartina alterniflora • Juncus roemerianus • A guiding shapefile was used from the U.S. Fish & Wildlife Service’s National Wetland Inventory
Vegetation – Marsh Grass (continued) • National Wetland Inventory’s (NWI) habitat shapefile came with various extraneous polygons as well that had to be weeded out • Areas associated with marsh grass were determined by the corresponding habit based on Cowardin classification • NWI’s shapefile needed to be reshaped to match up with aerial photography
Surface DEM Digital Elevation Model depicting the topography of the study area The better the DEM the more accurate the model will be AMEC obtained local Lidar as well as detailed coastline Lidar from NOAA’s Digital Coast website There was a concern of edge matching the DEM and Finite Mesh Development for storm surge modeling by FEMA and the Northwest Florida Water Management District
Surge DEM • Raster DEMs • 10 year surge • 100 year surge with wave setup • 100 year surge without wave setup
Over Water Fetch • Fetch is area of open water over which wind can blow (i.e. sounds, oceans, bays, etc) • Transfer of energy from the wind to the water caused by frictional drag • Larger the fetch the bigger the waves that can be generated by the wind
Data QA/QC • Field visits were made to select transects for data verification • Data and photos were recorded from these locations using a smart phone application • Many transect locations required coordination with other local and state agencies in order to record field data
Advantages of Smart Phone App • Data is uploaded immediately to server • No need to unload and then sort through large amounts of data once returning from the field • Data can be used instantaneously • If the phone is damaged or broken the data is not lost • Less equipment needed out in the field • Can be more efficient • Can go more places • Utilizes a variety of tools normally inaccessible out in the field • Data is uniform regardless of who is sent out in the field
Ready to Run the Coastal Tool Data is formatted and compiled, now we are ready to run the Coastal Tool 9 steps to the tool Tool guides you step by step Some of the 9 steps are optional dependent on the study area
Step 1 • Create Transect Database(s) • Sets up individual databases for each transect • Requires Surface and Transects shapefile
Step 2 • Integrate Survey • Optional step • Set Search Radius for distance from transects • Requires Survey Points
Step 3 • Dune Erosion • User chooses method of erosion: Retreat or Removal • Step is dependent on the presence of dunes in the study area • Requires PFD Crest, PFD Heel, and Surge DEMs
Step 4 • Populate Transect Nodes • This step utilizes the most customized GIS layers • Loads layer data into transect databases • Requires vegetation, buildings, over water fetch, PFD Crest, and Surge DEM layers
Step 5 • Generate WHAFIS Input • Transforms data into a WHAFIS models
Step 6 • Run WHAFIS • WHAFIS input and output files are placed in the transect databases
Step 7 • Generate RUNUP Input • Creates RUNUP model • User chooses a roughness coefficient
Step 8 • Run RUNUP Models • Puts outputs into transect databases
Step 9 • Generate Summary Transects • Integrates all the previous modeling steps to generate a summary of all relevant locations along each transect • This step analyzes where to determine zone breaks for mapping