Download
1 / 28
300 likes | 559 Views
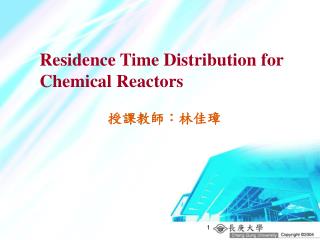
ERT 208/4 REACTION ENGINEERING: Distribution of Residence Times for Reactors (PART A). By; Mrs Hafiza Binti Shukor. ERT 208/4 REACTION ENGINEERING SEM 2 (2009/2010). Students should be able to;.

E N D
ERT 208/4 REACTION ENGINEERING: Distribution of Residence Times for Reactors (PART A) By; MrsHafizaBintiShukor ERT 208/4REACTION ENGINEERING SEM 2 (2009/2010)
Students should be able to; • DEFINE and DESCRIBE the cumulative F(t), external age E(t), and internal age I(t) residence time distribution (RTD) functions • RECOGNIZE these function for PFR, CSTR and laminar flow reactions. • APPLY these functions to CALCULATE the conversion and concentrations exiting a reactor using the segregation model and maximum mixedness model for both single and multiple reactions. ERT 208/4REACTION ENGINEERING SEM 2 (2009/2010)
overview; • Learn about nonideal reactors, that is reactors do not follow the models we have developed for ideal CSTRs, PFRs and PBRs. • Describe nonideal reactors using ; A)residence time distribution function, E(t) B) The mean residence time, tm C) The cumulative distribution fuction, F(t) D)The variance, σ2 ERT 208/4REACTION ENGINEERING SEM 2 (2009/2010)
overview; • Evaluate E(t), tm, F(t) and σ2 for ideal reactor, so we have a reference point as to how for our real (nonideal) reactor • Recognize all these functions & apply to calculate the conversion & concentrations exiting a reactor using certain model. ERT 208/4REACTION ENGINEERING SEM 2 (2009/2010)
Residence-time distribution (RTD) function… • In an ideal plug flow reactor, all the atoms of material leaving the reactor have been inside it for exactly the same amount time. • Similarly, in an ideal batch reactor, all the atoms of materials within the reactor have been inside it for an identical length of time. • The time the atoms have spent in the reactor is called the RESIDENCE TIME of the atoms in the reactor. ERT 208/4REACTION ENGINEERING SEM 2 (2009/2010)
Residence-time distribution (RTD) function…cont… • The idealized plug-flow and batch reactors are the only 2 classes of reactors in which all the atoms in the reactors have the same residence time. • In all other reactor types, the various atoms in the feed spend different times inside the reactor, that is a DISTRIBUTION OF RESIDENCE TIMES of the material within the reactor. ERT 208/4REACTION ENGINEERING SEM 2 (2009/2010)
Residence-time distribution (RTD) function…cont… • The residence-time distribution (RTD) of the reactor is a characteristic of the mixing that occurs in the chemical reactor. • There is no axial mixing in a plug flow reactor and this omission is reflected in the RTD. • The CSTR is thoroughly mixed and processes a far different kind of RTD than the plug flow reactor. ERT 208/4REACTION ENGINEERING SEM 2 (2009/2010)
MEASUREMENT OF RTD… • RTD is determined experimentally by injecting an inert chemical, molecule, or atom called a tracer, into the reactor at some time t=0 and then measuring the tracer concentration, C in the effluent stream as a function of time. • Tracer – nonreactive species that easily detectable (similar physical properties to reacting mixture and be completely soluble in the mixture) and should not adsorb on the walls @ other surface in the reactor. • Eg; colored & radioactive materials along with inert gasses are the most common type of tracer. ERT 208/4REACTION ENGINEERING SEM 2 (2009/2010)
MEASUREMENT OF RTD… • 2 most used methods of injection : A) pulse input B) step input ERT 208/4REACTION ENGINEERING SEM 2 (2009/2010)
a) Pulse input… • An amount of tracer, No is suddenly injected in one shot into the feed stream entering the reactor in as short time as possible. • The outlet conc is then measured as a function of time. ERT 208/4REACTION ENGINEERING SEM 2 (2009/2010)
a) Pulse input…cont.. • Typical conc-time curve at the inlet & outlet of an arbitrary reactor are shown below; 2 most used methods of injection : A) pulse input B) step input C Pulse response Pulse injection C Step injection C Step response t t ERT 208/4REACTION ENGINEERING SEM 2 (2009/2010)
a) Pulse input…cont.. • The effluent conc-time curve is referred to as the C curve in RTD analysis. • We shall analyze the injection of a tracer pulse for a single-input & single-output system in which only flow (no dispersion) carries the tracer material across system boundaries. ERT 208/4REACTION ENGINEERING SEM 2 (2009/2010)
a) Pulse input…cont.. Step; • Choose an increment of time ∆t sufficiently small that the conc of tracer, C(t) • Exiting between time t and t+∆t is essentially the same. • The amount of tracer material, ∆N leaving the reactor between time, t and t+∆t is then • Where, υ is the effluent volumetric flow rate. • ∆N is the amount of material exiting the reactor that has spent an amount of time between time t and t+∆t in the reactor. ERT 208/4REACTION ENGINEERING SEM 2 (2009/2010)
a) Pulse input…cont.. • Divide the total amount of material that was injected into the reactor, No, we obtain • Which represents the fraction of material that has a residence time in the reactor between time t and t+∆t. • For pulse injection, we define, • So that; ERT 208/4REACTION ENGINEERING SEM 2 (2009/2010)
a) Pulse input…cont.. • The quantity E(t) is called the residence-time distribution function that describes in quantitative manner how much time different fluid elements have spent in the reactor. • The quantity E(t)dtis the fraction of fluid exiting the reactor that has spent between time t and t+dt inside the reactor. • If Nois not known directly, it can be obtained from the outlet concentration measurements by summing up all the amounts of materials, ∆N between time equal to zero and infinity. ERT 208/4REACTION ENGINEERING SEM 2 (2009/2010)
a) Pulse input…cont.. • Writing in differential form yields, • And then integrating, we obtain • The volumetric flow rate, v is usually constant, so we can define E(t) as, ERT 208/4REACTION ENGINEERING SEM 2 (2009/2010)
a) Pulse input…cont.. • The integral in the denominator is the area under the C curve. • An alternative way of interpreting the residence-time function is in its integral form: Fraction of material leaving the reactor that has resided in the reactor for times between t1 and t2 = ERT 208/4REACTION ENGINEERING SEM 2 (2009/2010)
a) Pulse input…cont.. • We know that the fraction of all the material that has resided for a time t in the reactor between t=0 and t=∞ is 1. Therefore: • Next example will show how we can calculate and interpret E(t) from the effluent concentrations from the response to a pulse tracer input to a real (nonideal) reactor. ERT 208/4REACTION ENGINEERING SEM 2 (2009/2010)
Example: Constructing the C(t) and E(t) Curves (Pulse Input) A sample of the tracer hytaneat 320K was injected as a pulse to a reactor and the effluent concentration was measured as a function of time, resulting in the data shown in table below. The measurements represent the exact concentrations at the time listed and not average values between the various sampling tests. a) Construct figures showing C(t) and E(t) as functions of time. ERT 208/4REACTION ENGINEERING SEM 2 (2009/2010)
Example: Constructing the C(t) and E(t) Curves (Pulse Input)…cont… • Construct figures showing C(t) and E(t) as functions of time. Solution: C(t) as function of time - By plotting C as a fuction of time, using the data in table before, the curve shown in figure below obtain. C(t) Time (min) ERT 208/4REACTION ENGINEERING SEM 2 (2009/2010)
Example: Constructing the C(t) and E(t) Curves (Pulse Input)…cont… To obtain the E(t) curve from the C(t) curve, we just divide C(t) by the integral which is just the area under the C curve. Because one quadrature (integration) formula will not suffice over the entire range of data in the table given, we break the data into 2 regions (0-10 min & 10-14min). The area under the C curve can now be found using the numerical integration formulas (Appendix in text book). ERT 208/4REACTION ENGINEERING SEM 2 (2009/2010)
Example: Constructing the C(t) and E(t) Curves (Pulse Input)…cont… ERT 208/4REACTION ENGINEERING SEM 2 (2009/2010)
Example: Constructing the C(t) and E(t) Curves (Pulse Input)…cont… We now calculate, With the following results ERT 208/4REACTION ENGINEERING SEM 2 (2009/2010)
Example: Constructing the C(t) and E(t) Curves (Pulse Input)…cont… Solution: E(t) as function of time curve Tail-the long time portion of the E(t) curve E(t) Time (min) ERT 208/4REACTION ENGINEERING SEM 2 (2009/2010)
Example: Constructing the C(t) and E(t) Curves (Pulse Input)…cont… b) Determine both the fraction of material leaving the reactor that has spent between 3 and 6 min in the reactor Shaded area represents the fraction of material leaving the reactor that has resided in the reactor between 3 and 6 min. E(t) 51% of the material leaving the reactor spends between 3 and 6 min in the reactor 3 6 Time (min) ERT 208/4REACTION ENGINEERING SEM 2 (2009/2010)
Example: Constructing the C(t) and E(t) Curves (Pulse Input)…cont… c) Determine the fraction of material leaving the reactor that has spent between 7.75 and 8.25 min in the reactor. Because of the time between 7.75 and 8.25 min is very small relative to a time scale of 14min, we shall use alternative technique to determine this fraction to reinforce the interpretation of the quantity E(t). The average value of E(t) between these times is 0.06/min. Consequently, 3% of the fluid leaving the reactor has been in the reactor between 7.75 and 8.25min ERT 208/4REACTION ENGINEERING SEM 2 (2009/2010)
Quiz………(5 min) • Define the following terms; • Ideal reactor • Non ideal reactor ERT 208/4REACTION ENGINEERING SEM 2 (2009/2010)
End For Part A ERT 208/4REACTION ENGINEERING SEM 2 (2009/2010)