Download
1 / 17
170 likes | 284 Views
Roadmap for this week (Sept. 8 & 10) and next week (Sept. 15 & 17): : We’ll discuss the questions on the last slide of the “Economists” ppt file. We’ll discuss your thoughts on the current Sector weights of the Regents Portfolio.

E N D
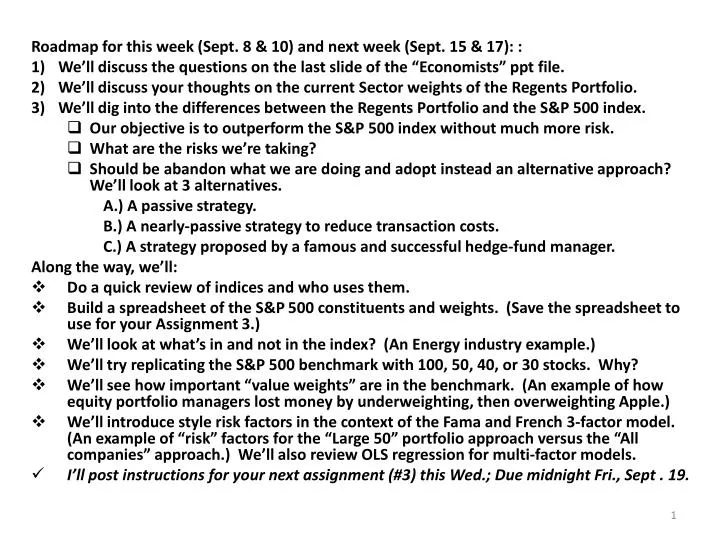
Roadmap for this week (Sept. 8 & 10) and next week (Sept. 15 & 17): : • We’ll discuss the questions on the last slide of the “Economists” ppt file. • We’ll discuss your thoughts on the current Sector weights of the Regents Portfolio. • We’ll dig into the differences between the Regents Portfolio and the S&P 500 index. • Our objective is to outperform the S&P 500 index without much more risk. • What are the risks we’re taking? • Should be abandon what we are doing and adopt instead an alternative approach? We’ll look at 3 alternatives. A.) A passive strategy. B.) A nearly-passive strategy to reduce transaction costs. C.) A strategy proposed by a famous and successful hedge-fund manager. Along the way, we’ll: • Do a quick review of indices and who uses them. • Build a spreadsheet of the S&P 500 constituents and weights. (Save the spreadsheet to use for your Assignment 3.) • We’ll look at what’s in and not in the index? (An Energy industry example.) • We’ll try replicating the S&P 500 benchmark with 100, 50, 40, or 30 stocks. Why? • We’ll see how important “value weights” are in the benchmark. (An example of how equity portfolio managers lost money by underweighting, then overweighting Apple.) • We’ll introduce style risk factors in the context of the Fama and French 3-factor model. (An example of “risk” factors for the “Large 50” portfolio approach versus the “All companies” approach.) We’ll also review OLS regression for multi-factor models. • I’ll post instructions for your next assignment (#3) this Wed.; Due midnight Fri., Sept . 19.
Here are the questions on the last slide of the “Economists” ppt file. 1) Read Ben Bernanke’s Jackson Hole speech from 2012 (see slide 19 for the link). Develop an answer to question 4 on slide 19. 2) What’s the current status of Quantitative Easing? 3) Watch the Bloomberg interview: “What will Janet Yellen say at Jackson Hole?” http://www.bloomberg.com/video/janet-yellen-what-will-she-say-at-jackson-hole-e_EpsVk1RnmYcU5o05uN7Q.html 4) Once Janet Yellen has given her speech Friday at Jackson Hole, search the Fed’s website for a press release of her speech and read it. For example, try using Google to search for Janet Yellen 2014 Jackson Hole. Or it might be posted by the Fed at: http://www.federalreserve.gov/newsevents/speech/2014speech.htm 5) Then read media reports (e.g., WSJ, Bloomberg, CNN, Financial Times) and market experts and see what they say about Janet Yellen’s remarks.
Bernanke’s 2012 Jackson Hole Speech Remarks by Governor Ben S. Bernanke at Federal Reserve Bank of Kansas City Economic Symposium, Jackson Hole, Wyoming.August 31, 2012 http://www.federalreserve.gov/newsevents/speech/bernanke20120831a.htm • In Bernanke’s August 31, 2012, Jackson Hole speech, he makes statements that made many economists conclude he still believed in fighting deflation by “printing money.” Following the speech, the Fed, under Bernanke’s leadership, expanded a policy of quantitative easing (“QE”). • What were the stated objectives of Bernanke for asset prices? (Consider stocks, bonds, and cash.) STOCK and BOND PRICES INCREASE; interest rates for Treasury and Corporate bonds remain low. Little to be gained investing in T-bills and money markets – so investors put their cash into stocks, bonds, real estate, etc. • Since the speech, has QE have the effect Bernanke wanted? Answer: see slide #9. • If “printing money” drives up asset prices, why not “print money” all the time? What are the risks?
Questions on the last slide of the “Economists” pptfile (continued) 1) Read Ben Bernanke’s Jackson Hole speech from 2012 (see slide 19 for the link). Develop an answer to question 4 on slide 19. 2) What’s the current status of Quantitative Easing? 3) Watch the Bloomberg interview: “What will Janet Yellen say at Jackson Hole?” http://www.bloomberg.com/video/janet-yellen-what-will-she-say-at-jackson-hole-e_EpsVk1RnmYcU5o05uN7Q.html 4) Once Janet Yellen has given her speech Friday at Jackson Hole, search the Fed’s website for a press release of her speech and read it. For example, try using Google to search for Janet Yellen 2014 Jackson Hole. Or it might be posted by the Fed at: http://www.federalreserve.gov/newsevents/speech/2014speech.htm 5) Then read media reports (e.g., WSJ, Bloomberg, CNN, Financial Times) and market experts and see what they say about Janet Yellen’s remarks.
2) We’ll discuss your thoughts on the current Sector weights of the Regents Portfolio. This is from the Excel file: “Corrected Regents portfolio spreadsheet as of Aug 15 2014” posted on the class website last week. It’s corrected for Qualcomm as IT, not Materials.
3) We’ll dig into the differences between the Regents Portfolio and the S&P 500 index. First, so we can make sure we all understand our S&P 500 index benchmark, let’s do a quick review of indices and who uses them.
DOW JONES INDUSTRIAL AVERAGE Indices ‘...everybody talks about them, but few people understand them…’ They are used: • To summarize market activity • To benchmark performance • To create index portfolios, ETFs and mutual funds 4. As explanatory factors in risk measurement models and other empirical studies S&P 500 INDEX
Indices: Three Weighting Methods • A price weighted index is proportional to the sum of the constituent prices (e.g. DJIA) • (SPrice per share)/Divisor • Biased towards high price stocks • A value weighted index is proportional to the sum of total capitalizations (e.g., S&P500) • S(Price per share × Number of shares) • Biased toward large market value companies • An equal weighted (aka unweighted) index cumulates equal weighted average returns: • S(% change in Price) / Number of companies • More numerous smaller companies are more important in this type of index than with the other 2 types
DJIA Price Weighted (Example) • Dow Jones Industrial Average (DJIA): • Thirty large cap stocks: • High price stocks carry more weight than low price stocks. • High growth companies with stock splits lose relative importance, thus downward bias. • For stock splits, they adjust divisor downwards to compensate. (instead of 30, divisor is much less now to adjust for past stock splits and composition changes.) 9/24/2010
Value Weighted (e.g., S&P 500) • Most stock market indices are calculated this way. • Uses market value weights: Price per share × Number of Shares Outstanding for each company (some use float instead of outstanding, publicly available shares). • Changes in large cap stocks (high market value) are relatively more important.
Unweighted / Equal Weighted • The arithmetic average of the percentage changes in price for all stocks in index. • Equivalent to investing the same $ amount in each stock, then rebalancing each period. • An equal weighted (unweighted) index is biased towards the returns of smaller companies relative to a value weighted index because small companies are quite numerous.
Index computation examples For example, we assume Company A has 100 shares outstanding, at price of $50 per share at time 0, and a price of $55 per share at the later time 1. Reminder: Market value = shares outstanding x price per share.
Simplified example of a price-weighted index such as the DJIA: Note that this type of index ignores the information about the number of shares outstanding for the firms.
Simplified example of a value-weighted index such as the S&P 500:
If Index was 100 on day 0, it would also be 100 on day 1: I0 (1+%D) = I1 Why are UnWeighted (Equal Weighted) indexes RARELY used as benchmarks for portfolio management?
Now let’s build a spreadsheet of the S&P 500 constituents and weights. (Please save the spreadsheet to use for Assignment 3.) We’ll use data available at: http://www.sectorspdr.com/sectorspdr/sector/xlp