Download

1 / 39
390 likes | 506 Views
Maximizing Return Marketing At The Right Weight. Phil Rincker. What weight should I market at?. Not a one size fits all answer Too many variables at play Disclaimer:

E N D
Maximizing ReturnMarketing At The Right Weight Phil Rincker
What weight should I market at? • Not a one size fits all answer • Too many variables at play • Disclaimer: • All data and grids contained in this presentation are completely fictional. The actual numbers presented here will not apply to your situation.
How Heavy Can I Go…? • Genetics • Stocking Density • Marketing Strategy • Space Needs • Seasonal impacts • Feed Cost • Carcass Price • Packer • Transportation • Risk • Will not include discussion on risk management
Genetics Commercial vs. Maternal vs. Specialty What is the growth potential? What is the FC at different weights? What happens from a lean perspective?
Genetics What does a 200 lb carcass look like? 230lb? What is your animal depositing at these weights?
Stocking Density • Initial stocking density will influence late finishing performance • K-value or K-factor • Caused by declining amount of space available • This is also responsible for the increase in growth and feed efficiency after first cuts are removed
Stocking Density • K-Values (Gonyou, et. al.; 2006) • Performance declines when pigs reach a given weight per unit of space • 0.033 meters2/kg metabolic body weight (aproximately 26-28 lbs/ ft2) • Pigs stocked at 6.5 ft2 will hit this at a lighter weight than pigs stocked at 7.5ft2
Stocking Density Initial stocking density and the subsequent decrease in performance may dictate when to take first cuts In order to take pigs heavier, initial stocking density may need to be adjusted Need to balance stocking density, target weight, and performance
Marketing Strategy • # of cuts / site visits • Precision vs. Simplicity • Biosecurity • Acceptable Variation • How narrow is the target on my grid?
Space Needs When do I need to empty this barn so other pigs can enter? Do I have enough time to hit my desired weights? Managing pig flow with today’s health challenges…
Seasonal Impacts • Cool season • Maximum intake • Maximum growth rate • Easier to hit target weight • Hot season • Reduced intake and growth • Space needs may dictate marketing weight rather than an optimal weight
Transportation • Bigger pigs will require more trucks to empty a site • Should try to keep lbs/ft2 constant Adapted from Ritter et. al. 2007
Transportation • Bigger pigs also show a tendency for increased chance of DOA or fatigued animals • May need to modify handling and loading SOP’s • Follow TQA guidelines for ventilation, showering, etc.
Risks Markets could change Morbidity and Mortality Wear and tear on facilities and equipment
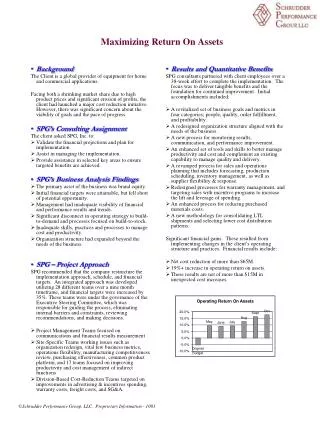
What is the goal? • Minimize sort loss/discounts • Packers grids are pretty stable • Maximize revenue • Heavier pigs will bring a bigger check • Maximize return (profit) • Targets will fluctuate depending on different economic scenarios • Carcass price, fixed and variable costs, other influences
Minimize Sort Loss Typical Weight and Lean Grid No sort loss area highlighted in green and white
Maximize Revenue Biggest check is highlighted in green
Maximizing Return • Fixed Costs – hard to influence short term • Variable Costs (feed, labor, utilities, vetmed…) • Largest contributor is Feed Cost • Where is the animal on its growth curve? • What is the Feed Conversion • Carcass Price • Open market, contracts, formulas… • Packer Grids
Maximizing Return • Need to understand how all of these fit together…Can be complicated • Simplified • Is there positive return on additional pounds of gain • Is Carcass Price > Additional Feed Cost • What is my maximum achievable return? • Every profitable lb of gain increases return
Simplified Examples • Additional considerations • Facility, labor, etc. • Packer discounts at heavier weights/fatter pigs
What drives the decision? • 18 months ago… • Higher feed cost, Lower carcass prices • Driven primarily by feed cost and feed conversion • Today… • Lower feed cost, Higher carcass prices • Additional gain is profitable…to a point • Driven primarily by packer grids
If I feed to a heavier weight, where do I land on the grid and how will I handle the discounts?
Margin Over Feed Cost (MOFC) • Revenue – Input Costs = Return • hopefully profit • Feed costs can account for nearly 73% of wean-finish production costs1 • Revenue – Feed Cost = MOFC • Pretty good indicator of return 1 Iowa State University Cooperative Extension Service. 2014. “Estimated returns forfarrowing and finishing hogs or producing weaned pigs in Iowa.” Addendum to M-1284c. Accessed 5/2/14. < http://www.econ.iastate.edu/estimated-returns/files/FWF/FWF14.pdf >.
Margin Over Feed Cost • Assumed • $220/ton ave diet cost • $1.00/lb carcass price • Excludes fixed costs
How does Sort Loss compare to MOFC? Sort Loss Grid MOFC Grid
Targeting Maximum MOFC My pigs average 54% lean, not 58% lean So I should target 240 – 250 lb carcasses (320-333 lb pigs)? Only if you sell one pig at a time
Single Pig vs. Population Model Really dealing with a distribution of weights, so where should I center that distribution? To far in either direction is sub-optimal
Margin Over Feed Cost CurveDistribution of individual carcasses Margin Over Feed Cost At some point, return starts to decrease due to poor feed efficiency, packer discounts, or both. The goal is to minimize the damage done by the tails of the distribution and maximize the return where the majority of the pigs land on the grid. 160 170 180 190 200 210 220 230 240 HCW
A distribution of carcasses Ave HCW = 205.5 lbs; Std Dev = 19.6 lbs
A distribution of carcasses Most profitable weight category at 54% lean Ave HCW = 205.5 lbs; Std Dev = 19.6 lbs • How far to the right can I afford to shift this distribution of pigs? • 5 – 10 lbs?
A new distribution Ave HCW = 205.5 lbs; Std Dev = 15.2 lbs
The same new distribution Most profitable weight category At 54% lean Ave HCW = 205.5 lbs; Std Dev = 15.2 lbs • How about this distribution? • 15-20 lbs?
What Causes Variation at Marketing? Fill Time vs Marketing Period Health Status/Challenges Marketing Strategy and Timing (tops) Short Space Pig Selection and Loading
Reducing variation allows us to target a more profitable weight for the entire population Margin Over Feed Cost HCW
How much more weight?As much as is profitable for the entire population
What weight to market at? • Understand your playing field • Prices (feed, pigs, etc.) • Packer grid • Marketing strategy • Expected HCW variation • Identify the correct weight for your system • Maximize MOFC for the entire group, not the individual pig
Measure and Review • Important to review these decisions and evaluate execution • System and site level • Immediate and longer term • Did we have the appropriate target weight? • Did we execute our marketing strategy and get the right pigs on the right truck? • What should we do differently?
Thank You Questions?