Download
1 / 29
290 likes | 394 Views
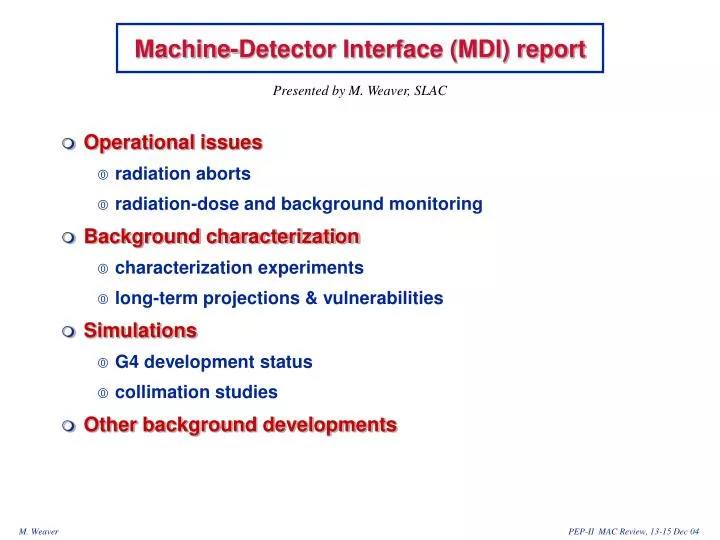
Machine-Detector Interface (MDI) report. Presented by M. Weaver, SLAC. Operational issues radiation aborts radiation-dose and background monitoring Background characterization characterization experiments long-term projections & vulnerabilities Simulations G4 development status

E N D
Machine-Detector Interface (MDI) report Presented by M. Weaver, SLAC • Operational issues • radiation aborts • radiation-dose and background monitoring • Background characterization • characterization experiments • long-term projections & vulnerabilities • Simulations • G4 development status • collimation studies • Other background developments
B. Petersen Run-4 radiation-abort history <stable-beam trips> ~ 1.7/day (Sep 03-Jul 04) <injection trips> ~ 0.6/day, 1-31 Jul 04
B. Petersen L. Piemontese / S. Foulkes Run-4 radiation-abort history (cont’d) Since 1 March 04 • 172/332 = 52% sympathetic aborts • <rad. signature-only aborts> ~ 1/day ...but ~ ½ of these are probably sympathetic!
B. Petersen Run-4 radiation-dose history HER trickle starts HER trickle starts increase probably instrumental Vacuum valve ROD Outgassing storms
LER injection-quality monitor HER injection-quality monitor Monitor using injection-gated triggers (1 ms x 15 ms) Injection- & trickle- background history EMC trigs (always on) LER trickle DCH trigs LER trickle EMC trigs (always on) HER trickle DCH trigs HER trickle
Stored-beam background history IDCH, msrd/pred DCH current normalized to Jan 04 background data 04 HEB sensitive 20% SVT ocp’cy @ f = 0 (LEB-sensitive) DCH ocp’cy 10% DCH L1 rate Dead time
Background sources in PEP-II • Synchrotron radiation (this bkg negligible in PEP-II, but not in KEKB) • Beam-gas (bremsstrahlung + Coulomb) • HEB only: BHbg ~ IH * (pH0 + PHDyn * IH) Note: p0 = f(T) ! • LEB only: BLbg ~ IL * (pL0 + PLDyn * IL) Note: p0 = f(T) ! • beam-gas x- term: BLHbg ~ cLH * IL * IH (LEB+HEB, out of collision) (?) • Luminosity (radiative-Bhabha debris) – major concern as L • BP ~ dP * L (strictly linear with L) • Beam-beam tails • from LER tails: BL, bb ~ IL * fL(xL,H+/-) • from HER tails: BH, bb ~ IH * fH(xL,H+/-) • Trickle background: BLi ,BHi(injected-beam quality/orbit + beam-beam) • Touschek: BLT(signature somewhat similar to bremstrahlung; so far small)
Data: Jan 04 (bef. therrmal outgassing crisis) Background characterization measurements Step 1: Beam-current scans single-beam terms
Total occupancy • HER single beam • LER single beam • Beam-beam term • present in all subdetectors • fluctuations, short - & long-term • parametrization optimistic ? Step 2: L & beam-beam terms EMC cluster multiplicity SVT occupancy (FL1 M01-f)
IDCH = DCH Step 3: Background Parametrizations • DCH example: total current & occupancies Step 4: Background Extrapolations 60 L Tracking efficiency drops by roughly 1% per 3% occupancy PEP-II parameter projections LER contribution very small
DCH + TRG When combined, higher trigger rates and long read-out time leads to unacceptable deadtime, driven by the DCH 3-step strategy • DCZ trigger (ready) • Waveform decimation (was implemented Summer ’04) • DCH DAQ upgrade (Summer 05) +DCZ
Backward: East Top West Bottom Background strongly - dependent By 2007 predict 80% chip occupancy right in MID-plane In layer 1, 10% will be above 20% occupancy NOW 2004 2005 2006 2007 Forward: East Top West Bottom Integrated dose will be more than 1 Mrad/year by 2007 SVT Background now is ~75% HEB [LEB negligible (!)] In 2007, it will be 50% HER, 50% L • It has been realized that in the SVT (but not in other subdetectors), a large fraction of the “Luminosity”background is most likely due to a HER-LER beam-gas X-term (but: similar extrap’ltn).
Given that future backgrounds have serious implications for detector performance, can anything be done to mitigate them? • Beam-gas backgrounds : manage residual gas pressure • Luminosity backgrounds : learn how to shield • Beam-beam backgrounds : learn how to collimate • How will the IR upgrade affect each of these? • Need to turn to simulation to improve our understanding and test mitigation strategies.
B Petersen N. Barlow M. Cristinziani/T. Glanzman J. Malcles Jan 2004 Apr 2004 Feb 2002 SVT occupancy Evolution of HER single-beam background, 2002-04 Jan 2004 EMC clusters Apr 2004 Regularly activating NEGs & TSPs does help ! We should continue to take advantage of single beam opportunities to monitor the background.
109 GeV/s @ L = 1034 P. Roudeau, A. Stocchi, W.K. (preliminary) Turtle Simulation : e+ e- e+e-g Background M. Sullivan - z (m)
E E Fwd q index Bkwd Electromagnetic shower debris or… EMC default digi map: luminosity background (N. Barlow) f index W
Neutrons Measurements appear consistent with Turtle radiative Bhabha simulation + GDR cross sections. Projected neutron rates may affect detector electronics – depends upon neutron energy spectrum. J. Va’vra
Turtle Level Simulations Beam-gas background from the HER (and LER) R. Barlow Where do scattered e-come from ? Where do scattered e-hit?
B1 Q1 Q2 Q4 Q5 Geant4 Simulations • Determining detector response requires Geant level simulation • Beam line up to Q5 implemented in Geant4 simulation of BaBar detector • Considering re-implementation for robustness but carrying on w/o • Added e-N, g-N and neutron transport to physics processes • Detector background analyses integrated for data and simulation alike • First full G4 simulation output of 2004 geometry recently available • Single beam background comparisons look good (normalization?) • Post-2005 configuration (IR upgrade) Turtle not ready
Beam-Beam Collimation Study Large X-Emittance: Phase Space Plot Starting x, x’ coordinates of particles lost along the beamline. x’/x; x/x Z location where particles are lost. Colors correspond to upper plot. Z [m] IP IP
+25.2 m from IP LER -25.2 m from IP X [mm] Results are based on an older LER deck (’98) with a tune of 0.57 (in x). X [mm]
Large-amplitude, horizontal b-tron tails originating at the IP can be effectively curtailed at + 25 m ...at least in the simulation basically because of the phase-advance relationships reduce this to a one-turn problem, and assuming the impact on LEB lifetime remains manageable. This study should be redone with the new LER deck & current x-tune of 0.51. Vertical tails are not an issue (in the LER) Pre-trickle collimator-scan data remain to be analyzed. However, the +25 m collimator can’t replace existing PR04 collimators in some corners of phase space provides no protection against Coulomb scatters between PR04 and PR02 Both horizontal and vertical b-tron tails will be studied for the HER Beam-beam collimation study: summary
Outgassing storms • Major background source: thermally-enhanced beam-gas • in incoming LER straight • Sensitive to LER current; several time constants in a time-dependent mix • Action: removed several NEGs and collimator jaws • Pressure at low currents may be worse now, but less susceptible to heating • SVT dose + occupancy (E-MID); minor impact on dead time • in incoming HER straight • sensitive to HER current, very long time constants • BaBar dead time + SVT occupancy (W-MID) • in (or very close to) the shared IR vacuum system • sensitive to both beam currents; at least 2 time constants • suspect: NEG + complicated IR ‘cavity’ (Q2L Q2R) + HOM interference • BaBar dead time + SVT occupancy (W-MID + E-MID) • HOM dominant heating mechanism • mostly long to very long time constants (30’-3 h): suggests low power • sensitive to: bunch pattern, VRF, collimator settings, Z(IP), hidden var’s
Continued BaBar involvement in Accelerator Performance Improvements (I) • Background analysis & mitigation [BP, MC/TG, NB, JM/JV, RM, LP, WK/GW] • Background simulations [RB, MB, GC, WL, SM, PR/AS, WK + SLAC (TF/GB)] • Fast monitoring of machine backgrounds available online in PEP-II CS [MW, C’OG, AP, GDF,...] • injection & trickle quality variables: SVT, DCH, EMC • subdetector occupancies: SVT, DCH, EMC, DIRC • BaBar dead time • more operator-friendly displays (& controls) of radiation inhibits/aborts • BaBar-based machine diagnostics • time distribution of injection triggers [LP, BP, ...] • Online centroids & sizes of luminous region using BaBar mm,ee [C’OG, BV, AP, IN, MB,...]
BaBar involvement in Accelerator Performance Improvements (II) • Beam dynamics • beam-beam simulations [IN (Caltech), YC (Slac ARD), WK] • beam-beam experiments, monitoring of beam-beam performance [WK] • e, b*, sz measurements using mm, ee • Instrumentation • Gated camera: now operational in both in LER & HER [DD, Slac Exptl Grp C] • LER interferometer software [AO, Orsay] • Installation of an X-ray beam-size monitor for the LER [Caltech + LBL + SLAC] • SVTRAD sensor & electronics upgrade [BP et. al. (Stanford); MB/DK et. al. (Irvine) (initiated & funded by BaBar)] • CsI background sensors , n detectors & shielding [JV, Slac Exptl Grp B] • Forward end Fe shielding wall (may allow better collimation elsewhere)
Summary (I) • Stable-beam (genuine) radiation aborts are down to ~ 1/day • Injection backgrounds under control, expect even better in Run5 • Stored-beam bgds (dose rate, data quality, dead time) • OK most of the time –watch for thermal outgassing, esp. HER • Background characterization experiments • Highly valuable in identifying the origin, magnitude & impact of single- & two-beam backgrounds – be opportunistic • Maintain a measure on the projected backgrounds – impacts detector remediation/upgrades with long lead times • G4 Simulation progressing; anticipate better understanding and correlation of sources with detector response • Collimation simulations can direct future background improvements
Summary (II) • In the medium term (2005-07), the main vulnerabilities are • beam-gas backgrounds from HOM-related thermal outgassing as I+,- • high dead time associated with DCH data volume & trigger rates (addressed by DCH elx upgrade) • high occupancy and radiation ageing in the mid-plane of the SVT, • possibly leading to a local loss of tracking coverage. • reduce the HER single-beam background back to 2002 levels (/1.5-2) ? • a high flux of ~ 1 MeV neutrons in the DCH (wire aging from large pulses, possibly also contributions to occupancy) • Background simulations • large investment in reviving/updating tools + rebuilding the group • ‘almost’ ready to evaluate backgrounds in IR upgrade • manpower limited • BaBar-based accelerator performance enhancement • common BaBar-PEPII diagnostics greatly improved, starting to pay off • very significant involvement of BaBarians in beam instrumentation & simulation
MDI abstracts submitted to PAC05 • Predicting PEP-II Accelerator-Induced Backgrounds Using TURTLE • R. Barlow, W. Dunwoodie, W. Kozanecki, S. Majewski, P. Roudeau, A. Stocchi , T. Fieguth & J. Va’vra • Modelling Lost-Particle Accelerator Backgrounds in PEP-II Using LPTURTLE • T. Fieguth, et al. • GEANT4-based Simulation Study of PEP-II Beam Backgrounds in the BaBar Detector at the SLAC B-Factory • W. Lockman, D. Aston, N. Barlow, N. Blount, M. Bondioli, G. Bower, G. Calderini, B. Campbell, M. Cristinziani, C. Edgar, W. Kozanecki, B. Petersen, S. Robertson, D. Strom, G. Wormser, D. Wright • Beam-induced Neutron Fluence in the PEP-II Interaction Region • G. Bower, W. Lockman, J. Va'vra, D. Wright • Measurement of the Vertical Emittance and beta Function at the PEP-II Interaction Point Using the BaBar Detector • J. M. Thompson & A. Roodman • Measurement of the Luminous-Region Profile at the PEP-II IP, and Application to e+/- Bunch-Length Determination • B.Viaud, W. Kozanecki, C. O’Grady, M. Weaver • Experimental Study of Crossing-Angle and Parasitic-Crossing Effects at the PEP-II e+e- Collider • W. Kozanecki, Y. Cai. I. Narsky, M. Sullivan & J. Seeman
Measurement of the Vertical Emittance and beta Function at the PEP-II Interaction Point Using the BaBar Detector • J. M. Thompson & A. Roodman • Measurement of the Luminous-Region Profile at the PEP-II IP, and Application to e+/- Bunch-Length Determination • B.Viaud, W. Kozanecki, C. O’Grady, M. Weaver • Experimental Study of Crossing-Angle and Parasitic-Crossing Effects at the PEP-II e+e- Collider • W. Kozanecki, Y. Cai. I. Narsky, M. Sullivan & J. Seeman