Download
1 / 64
680 likes | 868 Views
Nutrition in food security assessments: The links . 5 th - 9 th December 2011, Rome. Nutrition basics. Malnutrition? An abnormal physiological condition causes by deficiencies, excesses or imbalanced of nutrients or energy. Measurement of Malnutrition:

E N D
Nutrition in food security assessments: The links 5th - 9th December 2011, Rome
Nutrition basics • Malnutrition? • An abnormal physiological condition causes by deficiencies, excesses or imbalanced of nutrients or energy. • Measurement of Malnutrition: • Anthropometry and Nutritional Status
Why is anthropometry important? • Anthropometry is the easiest way to measure nutritional status. • INDIVIDUALS • Defines who has adequate nutrition and who is malnourished • POPULATIONS • Determines prevalence of malnutrition in surveyed populations
Why anthropometry in CFSVAs? • Primary goal: To link food security with nutritional outcomes, controlling for other influences (health/hygiene, caring practices) • Secondary goal: to provide indicative levels of key nutritional outcomes by zone, administrative boundary, or other grouping, as appropriate. • These goals must be clearly stated, agreed upon internally and with partners, and technically supported before the survey takes place!
Why anthropometry in CFSVAs? 2 • The distinction between these two purposes has large implications on CFSVA design. • If nutrition is being collected only to relate to food security (primary goal), then tight sampling restrictions and other considerations are less. • If nutrition is being gathered to also provide prevalences by certain strata, then issues such as tight sampling restrictions will become more important • It is preferable, when possible, to satisfy both goals.
What are the two types of Growth Failure? Occurs as a result of recent rapid weight loss or a failure to gain weight ACUTE MALNUTRITION WASTING (thinness) Occurs as a result of inadequate nutrition over a long period of time CHRONIC MALNUTRITION STUNTING (shortness)
The building blocks of anthropometric indicators Sex Age 1 2 Height (standing or lying) Weight MUAC Oedema 4 5 6 3
Height/ length Weight Age Height/ length Weight Age Use of building blocks To assess if child is “stunted” or short for his age chronic malnutrition MUAC or Oedema and To assess if child suffers from any type of protein-energy malnutrition underweight To assess if child is “wasted” or thin for his height acute malnutrition
The key indicators of nutritional status 1 Weight-for-Height (WFH) reflects recent weight loss ACUTE MALNUTRITIONWASTING Height-for-Age (HFA) reflects skeletal growth CHRONIC MALNUTRITIONSTUNTING Weight-for-Age (WFA) is a composite index WASTING UNDERWEIGHT &/or STUNTING
MUAC: Mid Upper Arm Circumference WASTING THE RISK OF MORTALITY FROM ACUTE MALNUTRITION
Bilateral oedema (SAM) Marasmus Kwashiorkor
Who is stunted and who is wasted? A B C D A: Healthy B: Stunted C: Wasted D: Stunted & Wasted
Hidden hunger Micronutrient deficiency • Iodine, vitamin A and iron deficiencies are the most important Their lack represents a major threat to the health and development, particularly children and pregnant women • Vitamin A deficiency (VAD) • Leading cause of preventable blindness in children • Increases the risk of disease and death from severe infections • An estimated 250 000 to 500 000 vitamin A-deficient children become blind every year, half of them dying within 12 months of losing their sight
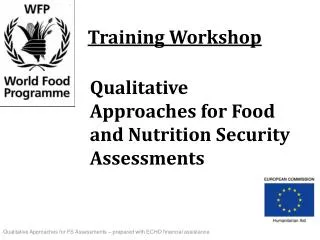
CALCULATING • www.smartmethodology.org • www.who.int
At which age do we see most wasting? • Wasting is more common amongst children during the weaning period. • Complementary foods are often inadequate. • Complementary foods are often not prepared in hygienic conditions which can result in diarrhoea. • Young children are susceptibles to other diseases.
ENA Report Table 3.2: Prevalence of acute malnutrition based on weight-for-height z-scores (and/or oedema) and by sex Prevalence of oedema is 0.0 % Table 3.3: Prevalence of acute malnutrition by age, based on weight-for-height z-scores and/or oedema
Who is at risk of stunting? • Stunting occurs over a long period. • The poor quality of food is one of the factors in stunting. • Action is necessary in the formative years to prevent stunting.
Analysis and reporting • This example presents an external validation of the CFSVA nutritional findings against DHS findings. • This example is lacking 95% CI, which would allow a better comparison between the survey findings.
Nutrition and food security • Assessments within WFP follow the conceptual framework: the nutritional status is an outcome of food security(and/or other factors).
Underlying causes of malnutrition Malnutrition Immediate Causes Inadequate Food Intake Infection Underlying Causes Household Food Security Social and Care Environment Access to Health Care & Healthy Environment Formal & Informal Infrastructure Political Ideology Resources Basic Causes
Nutrition in food security assessments • Improved food security and nutrition analysis should lead to more appropriate and targeted responses. • In assessments include core information on the factors influencing both food and nutrition security. • Non-food causes of nutrition insecurity are incorporated in assessments (poor health environment, inadequate care practices), but are less developed than food-related causes.
IMPORTANT !!! • Good quality data allows us to have good analysis. We cannot have good analyses from poor quality data.
Key crosstabulation - Descriptive Nutrition Strata • Sex of the child • Child age groups • Sex of the household head • Region/province • Livelihood groups • Ethnic group • Urban / rural • Total • Wasting (WHZ and or MUAC) • Stunting (HAZ) • Underweight (WAZ)
Key crosstabulation – analysis Nutrition Food security / access • Wasting (WHZ and or MUAC) • Stunting (HAZ) • Underweight (WAZ) • Economic vulnerability • Expenditure / income • Share food expenditure • CSI • Diet quality • FCS • FC groups • Diet diversity • Food energy from staples • Diet quantity • Kcal
Key crosstabulation – analysis Nutrition Other household critical indicators • Wasting (WHZ and or MUAC) • Stunting (HAZ) • Underweight (WAZ) • Improved source of water • Improved sanitation • Crowding index • Household size • Percentage of dependents • Asset /wealth index • Household has chronically sick member • Etc…
Key crosstabulation – analysis Nutrition Mothers • Wasting (WHZ and or MUAC) • Stunting (HAZ) • Underweight (WAZ) • Health status • Antenatal cares • Age of the mother? • Education • Number of kids
Key crosstabulation – analysis Nutrition Health – child care • Health care access • Hand washing • Breastfeeding practices • Complementary feeding practices • Child diet diversity score (IDDS) • Child food consumption score? • Immunizations • Prevention (mosquito net) • Wasting (WHZ and or MUAC) • Stunting (HAZ) • Underweight (WAZ)
Reporting • For anthropometry • Prevalence % • Number of measured children • CI • For FS analysis • Correlations levels and/or if the relation is significant • Level of Sig. (<0.05 or 0.01)
Incorporating nutrition into food security analysis • Relating food security to nutritional outcomes. • Nutrition can be analyzed as an outcome of food consumption/security (nutritional status as the dependant variable) CAUSAL (two-way or multi-way) ANALYSIS • Nutrition can be a descriptive variable of food consumption/security DESCRIPTIVE (one-way) ANALYSIS • Nutrition can be viewed as a component of food security (utilization) NUTRITIONAL STATUS + X = FOOD SECURITY
Incorporating nutrition into food security analysis (or.. food security into nutrition analysis) • There are several methodologies for making the link between food security and nutritional outcomes. This depends on the approach to food security taken (remember the analytical frameworks). • Descriptive analysis (one way analysis) • Food security = nutrition security (depending on interpretation) • Causal/relational analysis (descriptive analysis, plus two-way or multivariate analysis, examples following) • Is food consumption/household food security an underlying cause of nutritional status, or are other factors at play?
Two-way analysis • Starting to make statements of association
Multi-way analysis • … and linking food security and nutrition
Case study - Liberia • Areas found to have high food insecurity (by several methodologies) do not have the highest prevalences of stunting, wasting, underweight. • How is this reconciled?
From the regression analysis • The analysis revealed: • Food consumption is not associated with wasting. • Food access is not associated with wasting. • Wasting is primarily associated with perceived birth size, caring practices (age of introduction of solid foods), and episodes of diarrhea • Female children and older children are significantly less wasted than male children and younger children • MCH food assistance played a role in improving nutritional status of children • Continued breastfeeding in addition to intake of cereals and liquids as revealed by 24-hour recall had better impact on the nutritional status of young children • Children who were introduced to solid foods especially before the age of four months were more wasted than other age groups
Example question: • In Swaziland, is there a difference in nutritional status depending on socio economic status, estimated by assets (asset poor/not asset poor),independent of education attainment?
Example from Swaziland From Swaziland data. Education of mother, asset poor/not asset poor
We could also do a regression analysis to explore the statistical significance of this same question. Regression Analysis
Example question two: • In Swaziland, is stunting status related to the age of the child, independent of sex of child? • Is stunting status related to the sex of child, independent of age?