Download
1 / 12
120 likes | 251 Views
How Statistics Won World War II. Math Olympiad 2011 Northwest Missouri State University Neil Hatfield. The Problem. In 1941-1942, US and British tanks were far superior than the German Panzer tanks.

E N D
How Statistics Won World War II Math Olympiad 2011 Northwest Missouri State University Neil Hatfield
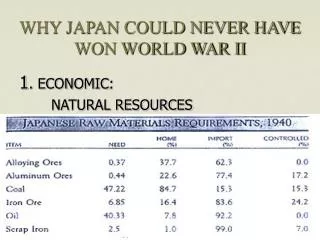
The Problem • In 1941-1942, US and British tanks were far superior than the German Panzer tanks. • The Germans made revisions to the Panzers and introduced the much more powerful Mark V tanks. • The Allied Forces were unsure how many Mark V tanks the Germans could produce, thus making it unclear whether or not any invasion of the European continent on the western front would succeed.
The Problem, cont. • The Critical Question: “How many Mark V tanks are produced each month?” • British and American Intelligence agencies worked separately and independently to try and answer this question. • Best Estimate: 1,400 tanks produced per month • British and American Statisticians also became intrigued by the problem and began working. • Vital Information: Both groups and access to the Serial Numbers of captured Mark V tanks. The Serial Numbers were known to be sequential. • Your Challenge: Choose a good estimator for the total number of tanks produced each month.
The Challenge • You will each work in a team of fellow statisticians. • Each team will need to decide on a possible method for estimating the number of tanks produced each month. • Possible Methods: • Take the sample mean and add three times the standard deviation. • Double the sample mean. • Double the sample median. • The sky is your limit. • Once your team has decided upon a method, you will then need to do some data collection. • Each team will make use of one paper and one bag found on the tables.
The Challenge, cont. • Each team needs to record their method on their paper. • Each team will then randomly draw out five (5) cards from their paper bag WITHOUT LOOKING. • Record these numbers on the packet and as well as the Mean and Standard Deviation • Use your group’s method to calculate , the estimated total number of tanks produced each month. • Repeat this process two more times. • Find the mean of your three values and report that to me.
Values for 344
Which method (estimator) was best? • What is meant by the word “best”? • You can’t judge an estimator by how it performs on one random sample. • We need to evaluate it over many random samples. • We want our estimator to be unbiased. • Unbiased: on average, the estimator hits the true value of what it is estimating. • Biased: on average, the estimator misses the true value of what it is estimating. (Systematically misses.) • We would like our estimator to have low variability. • We would like the estimates produced over many random samples to be relatively close to one another.
Biased/Unbiased Estimators Unbiased Biased True Value
High/Low Variance Estimators Low Variance High Variance True Value
What was actually used? • The British and American statisticians ended using the following estimator. • is the estimate for the total number of tanks produced that month. • M is the maximum serial number sampled. • nis the sample size. • They estimated that 246 tanks were produced each month. • After the war, German production records revealed that production was actually 245 tanks per month.
Does this end here? • No! • The process that we have used here can be used in other ways. • The number of buzzers at a restaurant. • The number of taxis in New York City. • iPhones • In 2008, an man in London asked people to post their iPhone serial number and the date of purchase. From this information, he was able to calculate that Apple had sold 9.1 million iPhones by the end of September. • Generate another set of research questions similar to what we did here and propose a strategy to find a potential solution to each