Download
1 / 36
360 likes | 521 Views
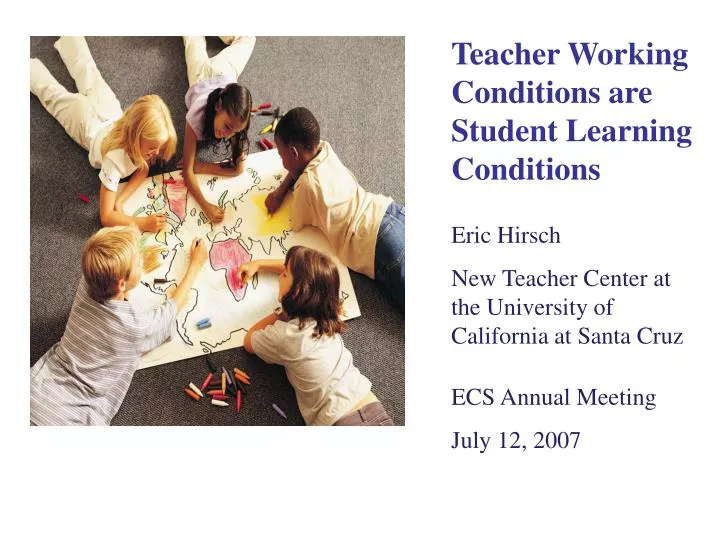
Teacher Working Conditions are Student Learning Conditions Eric Hirsch New Teacher Center at the University of California at Santa Cruz ECS Annual Meeting July 12, 2007. Reasons for Teacher Dissatisfaction.

E N D
Teacher Working Conditions are Student Learning Conditions Eric Hirsch New Teacher Center at the University of California at Santa Cruz ECS Annual Meeting July 12, 2007
Reasons for Teacher Dissatisfaction Source: Richard M. Ingersoll, Teacher Turnover and Teacher Shortages: An Organizational Analysis. American Educational Research Journal, 38 (Fall 2001): 499-534.
Gathering Customized Data to Understand Schools • Full population survey of every educator in order to gather school data as each is unique in their issues as well as in investments and commitment toward improvement • Online survey with individual access codes to ensure valid process with backing of broad coalition • About 30 core questions asked identically across all states to allow for cross-state analyses • Data put up on the web and public to educators, the community and policymakers (varies by location)
Surveys in 2006 and 2007 • Kansas – 53% response rate statewide with over 21,000 educators and data available for about 1,000 schools • Mississippi – 67% response rate statewide with data from more than 25,000 educators • Nevada – 49% response rate for Clark County (over 8,000 educators) done annually as part of CCSD/CCEA interest-based agreement. Similar response rate in 2007 • Ohio – pilot in 2005 and voluntary survey in 2006 and 2007. Data from 2007 for over 15,000 (44% response rate) educators in 310 schools across 65 districts • Arizona – 70% response rate in 7,500 educator phase-in 2006 and 53% response rate with more than 32,000 educators statewide in 2007 • North Carolina – 66% response rate statewide with over 75,000 educators and data for 1,985 of 2,200 schools. Survey conducted in 2002 (38% response rate) and 2004 (38% response rate) • More than 250,000 respondents to the survey in the past 3 years
Teachers on Which Working Condition is Most Necessary to Improve Student Learning
“If I am allowed to utilize my teaching expertise—to draw from what I know will engage and stimulate my students—then students will achieve at levels no one could dream of. If I am hampered…then I can’t do what I do best.” - Teacher, Published in Threshold Magazinearticle on teacher working conditions
TWC Questions in NC – Elementary by Performance Percentage agreement that working condition is in place based on quartiles of elementary schools on the North Carolina ABC Performance Composite.
Six CTQ studies from five states demonstrate clear and significant connections between teaching conditions and student achievement and academic growth In most cases, up to 20 – 25 percent of the variance in school achievement can be attributed to teaching conditions (particularly empowerment and leadership questions) at all levels Empowerment mattered in Clark; leadership and facilities and resources in NC, particularly for student growth. Time highly correlated in Arizona at 4th and 12th grade levels. Teacher Working Conditions are Student Learning Conditions
E=Elementary, M=Middle, H=High, G=Growth Indicator, A=Overall Achievement Indicator Note: Table only includes questions that were statistically significant in more than one location. See individual reports for full explanation of models and impact of questions on achievement measures.
Examples of the Impact of TWC on Student Learning • In Kansas, for every 10 percent of elementary teachers who agree that the faculty is committed to helping every student learn, a 2.7 percent increase in students passing the state math assessment can be estimated (1.4 percent at the high school level). A 1.1 estimated increase in the middle school performance composite was found in North Carolina • In North Carolina elementary schools where 60 percent or more of the staff agree that class sizes are reasonable, they are 1.3 times more likely to meet or exceed growth expectations. Middle schools where 80 percent or more of the faculty agree there is an atmosphere of trust and mutual respect were 2.2 times more likely to meet or exceed growth expectations • For every 10 percent of Kansas middle school students who agree that their school is safe, a 2.3 percent increase in students passing the math assessment can be estimated
Teachers on Which Working Condition is Most Important to Future Employment Plans
“Without a doubt, the principal is the number one factor in determining the desirability of being a part of a particular school community. Being respected and valued personally and professionally is something I have to have in order to stay in a school.” - Teacher, published in Threshold Magazine article on teacher working conditions
Source: Hirsch, E. et al. Teacher Working Conditions Are Student Learning Conditions: A Report on the 2006 North Carolina Teacher Working Conditions Survey. Feb. 2007: CTQ.
TWC Kansas – Elementary School Agreement by Expected Turnover Working Conditions by Performance Composite Quartile Source: Hirsch, E. et al. CreatingConditionsfor Student and Teacher Success: A Report on the 2006 Kansas Teacher Working Conditions Survey. May 2007: CTQ
More than 40 percent of teacher future employment plans could be explained by working conditions in Clark County In Arizona, correlations with future employment intentions statistically significant for all conditions (except PD) and highest for leadership (.633). Correlations significant for all working conditions in Kansas Analysis of actual turnover in North Carolina – can explain about 40 percent of turnover. Up to 8 percent for elementary, 12 percent for high schools, but 34 percent for middle schools with working conditions Teaching Conditions Affect Turnover
In Las Vegas, the presence of an atmosphere of trust and mutual respect was the most powerful predictor of any variable on whether a teacher would continue working in their current position. For every 10 percent of teachers agreeing that trust is present, a 3.1 percent increase in the percentage of teachers wanting to stay could be expected If 40 percent or LESS of the faculty in a school believed that they are respected as educational experts, the school is 2.7 times more likely to have a high expected turnover rate in Kansas elementary schools Teaching Conditions Affect Turnover
Teachers and Administrators View Working Conditions Differently
Source: Hirsch, E. et al. Teacher Working Conditions Are Student Learning Conditions: A Report on the 2006 North Carolina Teacher Working Conditions Survey. Feb. 2007: CTQ.
Source: Hirsch, E. et al. Teacher Working Conditions Are Student Learning Conditions: A Report on the 2006 North Carolina Teacher Working Conditions Survey. Feb. 2007: CTQ.
In North Carolina, schools that used working conditions results as a tool for school improvement showed improvements in critical areas. For example, low TWC data use schools dropped from 63 percent to 42 percent agreement that there is an atmosphere of trust versus high use schools improved 2.2 percent (from 76 to 79 percent) between 2004 and 2006 Little variation in how individual educators viewed working conditions was found. But big differences existed across states in whether or not there was a teacher working conditions gap present in schools serving high poverty and high minority student populations Other Findings from State Reports
State and District Policies to Improve Teaching and Learning Conditions
Established TWC Survey as permanent part of budget TWC every 2 years as part of the budget Associated research and findings at both the statewide and school levels Established NC TWC Advisory Board to oversee implementation and dissemination of survey and the findings to school level as well as policy development Provides funding ($100K annually) to NCNetwork for SIT plans incorporating TWC data Evaluation of school principals SBE required to revise evaluation instrument for principal evaluation to include accountability of teacher retention, teacher support, and school climate State TWC Policies Passed in North Carolina
Revision of MSA standards (Masters in School Administration) SBE required to revise MSA program standards to focus on providing positive school climate, teacher support, and teacher retention Requires all new principals To complete the Principals Executive Program (PEP) - focusing on TWC; provides $125K Creating 100 school-based family support teams - including school nurse and social worker at 100 schools in need State TWC Policies Passed in North Carolina
Planning time for teachers- HB 1151 passed- requiring all SIT to document a plan to provide planning time for every teacher (goal of 5 hours per week) , and a duty-free lunch Expansion of Learn and Earn and New Schools Project (Gov.'s 21st Century High Schools) - at the core of the design of these new high schools is the foundation of planning time for teachers to beable to do their work • Unprecedented funding to support disadvantaged students and districts: $112 Million in new dollars • This includes the Low Wealth fund, DSSF monies to all 115 districts, and return of the discretionary reduction-new focus on teacher recruitment, retention, and support State TWC Policies Passed in North Carolina
State TWC Policies Passed in North Carolina Leandro districts:provides continuation 2M$ of custom professional development to DSSF schools/ districts based on TWC survey and ABC scores Customized analysis for original DSSF districts high schools in Turnaround High Schools All high schools under 70% proficiency for last two years Best Practices highlighted and shared through the Real D.E.A.L. Award winning schools
Allow for flexibility and foster innovation in scheduling and planning time • Encourage principal to principal discussions that allow for open dialogue and sharing of ideas and experiences • Provide guidance on expectations for use of planning time without becoming overly prescriptive • Building in rewards for non-instructional time • Prioritize planning in the allocation of resources
Administrators and faculty share a vision for the school • Schools have an effective group decision-making and problem-solving process • School leadership consistently supports teachers
For More Information Eric Hirsch New Teacher Center at the University of California at Santa Cruz teachingconditions@gmail.com (temporary) 919-951-9043 (cell) www.teachingquality.org – for reports www.teacherworkingconditions.org – for online toolkit