Download
1 / 9
90 likes | 202 Views
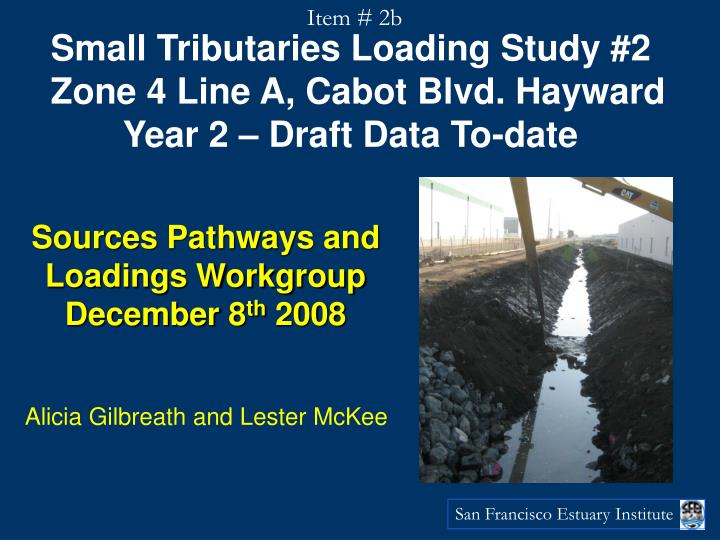
Item # 2b. San Francisco Estuary Institute. Small Tributaries Loading Study #2 Zone 4 Line A, Cabot Blvd. Hayward Year 2 – Draft Data To-date. Sources Pathways and Loadings Workgroup December 8 th 2008. Alicia Gilbreath and Lester McKee. San Francisco Estuary Institute. Item # 2b.

E N D
Item # 2b San Francisco Estuary Institute Small Tributaries Loading Study #2 Zone 4 Line A, Cabot Blvd. Hayward Year 2 – Draft Data To-date Sources Pathways and Loadings Workgroup December 8th 2008 Alicia Gilbreathand Lester McKee
San Francisco Estuary Institute Item # 2b Season Data Inventory
San Francisco Estuary Institute Item # 2b • HgT range (n=22): 3 – 147 ng/L • HgD range (n=11): 1.5 – 2.9 ng/L • Hg(II)R (n=9): ND – 1.9 pg/L WY 2008 data DRAFT and subject to change.
San Francisco Estuary Institute Item # 2b • t-PCB range (n=32): 336 – 102,234 pg/L WY 2008 data DRAFT and subject to change.
Item # 2b WY 2008 data DRAFT and subject to change.
San Francisco Estuary Institute Item # 2b WY 2008 data DRAFT and subject to change.
San Francisco Estuary Institute Item # 2b WY 2008 data DRAFT and subject to change.
San Francisco Estuary Institute Item # 2b • Construction delay and few punctuated storms during potential sampling period led to opportunity to collect low-flow samples • Draft results for Hg and PCBs generally correlate with the first year of data • Low-flow data adds robustness to complete dataset