Download
1 / 28
280 likes | 386 Views
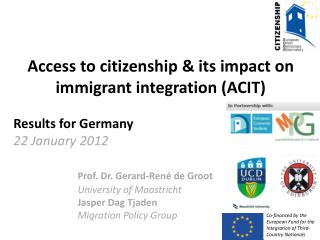
Access to Citizenship & Its Impact on Immigrant Integration. Preliminary Results for Spain December 14, 2012 Barcelona Center for International Affairs Kristen Jeffers Jasper Dag Tjaden ACIT Researcher Policy Analyst University College Dublin Migration Policy Group.

E N D
Access to Citizenship& Its Impact on Immigrant Integration Preliminary Results for Spain December 14, 2012 Barcelona Center for International Affairs Kristen Jeffers Jasper Dag Tjaden ACIT Researcher Policy Analyst University College Dublin Migration Policy Group
EUDO Citizenship • European Union Democracy Observatory (EUDO), Robert Schuman Centre of the European University Institute in Florence • Goal: to provide data for research and public policy • Features: • Databases: national citizenship laws, citizenship case law, modes of acquisition, modes of loss, citizenship statistics • Publications: country reports, comparative citizenship analyses, working papers, policy briefs • Citizenship news • Citizenship forum • Citizenship indicators: law, implementation, acquisition, integration • Five partner institutions:
ACIT Project • Access to Citizenship and its Impact on Immigrant Integration • Collection and comparison of national and international evidence on effect of the the acquisition of citizenship on immigrants’ participation in society and the democratic process • Four sets of citizenship indicators: • CITLAW: indicators of legal provisions of citizenship laws • CITIMP: indicators of formal and informal aspects of naturalisation procedures • CITACQ: descriptive data of citizenship acquisition in European countries with a specific focus on the naturalisation of immigrants • CITINT: descriptive data about differences in integration outcomes • Explaining the impact of citizenship laws on • CITACQ: acquisition rates • CITINT: post-acquisition outcomes (integration, participation, mobility) • In-depth case studies in 10 EU Member States: Austria, Estonia, France, Germany, Hungary, Ireland, Italy, Portugal, Spain, United Kingdom
Citizenship Law (CITLAW) Indicators • 57 indicators compare specific aspects of citizenship regimes across countries and time • basic indicators (e.g. ius soli for second generation) • several combined indicators (e.g. ius soli at birth) • six combined indicators: iussanguinis, ius soli, ordinary naturalisation, special naturalisation, renunciation, withdrawal • Indicators measure the degree of inclusion and individual choice (vs. exclusion and state power to determine acquistion or loss): • Indicator scores range from 0 to 1 0 = lowest degree of inclusion or individual choice 1 = highest degree of inclusion or individual choice
Ordinary Naturalisation opportunities • language requirements • civic knowledge requirements obstacles • residence requirement: • Belgium (min) 1.00 • Spain 0.29 • Greece (max) 0.24 • EU-15 0.61 • toleration of dual citizenship • criminal record requirements • economic resources requirements
Special Naturalisation obstacles • stateless persons opportunities • spousal transfer • child transfer • adoption • reacquisition • historical and cultural affinity • refugees
Citizenship Implementation Indicators (CITIMP) • 38 indicators compare formal aspects of naturalisation procedure. These include all stages, from efforts by public authorities to inform applicants to the options to appeal a negative decision. • 5 dimensions covered administrative procedure: • Promotion: how much do authorities encourage applicants to apply? • Documentation: how easily can applicants prove they meet the conditions? • Discretion: how much room do authorities have to interpret conditions? • Bureaucracy: how easy is it for authorities to come to a decision? • Review: how strong is judicial oversight of the procedure?
Summary of Findings Positive link between law (CITLAW) & implementation (CITIMP) Spain slightlybelow EU-15 average (only ,47 out of 1,00)
Onlyaveragepolicies to promote naturalisation • Demanding documentation, more than in most EU15 countries • Slightlydiscretionaryprocedure, more sothan in most countries • Just as bureaucratic as in most countries • Strongjudicialreview • Procedures in Spain are mostsimilar to those in Austria
Results by dimension Promotion OppCosts and basic promotionalmaterials Obs Support to passrequirements, promotional service or campaign Discretion Opp Limited discretion on residencerequirement ObsDiscretionaryprocedure & language/integrationassessment Review OppAppeal to highestlevel of procedure & integrationassessmentthatcan change decision in merit Obs Time limits, difficult to interpretdecision on lang./integ.
Documentation Documentation is more demandingthan in most EU-15 countries • Complicated documentation on identity, criminal record, job situation • Documentation from country of origin (identity, criminal record) • No flexibility on proof of language and integrationassessment • Few exemptions on humanitarian or accessibility grounds Spain
Citizenship acquisition (CITACQ) • Acquisition indicators compare the rates of citizenship acquisition among foreign-born persons in their country of residence • Percentages of foreign-born immigrants who have acquired citizenship at any point in time, not naturalisation rates measuring the number of new naturalisations divided by resident population with foreign citizenship • Information based on European Labour Force Survey Survey Ad Hoc Module (2008) that targets immigrants and their descendants, aged 15-67 • Data exclusively on foreign-born (1st generation) and allows for comparisons of citizenship acquisition rates across 25 European countries
Citizenship acquisition (CITACQ) Includes information on the following indicators for citizenship acquisition by foreign-born: • ALL • SEX (female vs. male) • ORIGIN (EU vs. non-EU countries) • AGE AT MIGRATION (age at which respondent took up residence) • YEARS OF RESIDENCE (years of residence) • YEARS OF RESIDENCE (minimum number of years of residence) • TIME UNTIL NATURALISATION (numbers of years until naturalisation)
Summary of Findings • On average around 34% of foreign-born persons are a citizen of their EU-15 country of residence. • Citizenship acquisition rates in EU-15 range are lowest in Luxembourg (10%) and highest in Sweden (67%). The rates in Spain (16%) below the EU-15 average. • Immigrants from non-EU countries (42%) more often acquire citizenship than those from EU countries (20%). • On average it takes around 10 years for foreign-born persons to acquire citizenship of their country of residence, within EU-15 countries. • In Luxembourg it takes almost 15 years (on average), whereas in Spain this is around 9 years.
Speed of naturalisation Spain
Analysis of acquisition rates Citizenship acquisition & speed of acquisition are mainly driven by: • Socio-economic development of countries of origin • Citizenship laws of the country (see following graph) Variation in acquisition rates is mainly explained by: • Marital status (married people are more likely to be naturalised) • Socio-economic status (employed immigrants are more likely) • Gender (female immigrants are more likely) • Use of native language at home (immigrants who speak the language of the destination country at home are more likely)
Predicted probability of having destination country citizenship by MIPEX Access to Nationality (by years of residence in country) Spain (29) Spain (29) MIPEX Access to Nationality score (adjusted for first generation only), Austria: 34
Citizenship and Integration (CITINT) • 10 core indicators measure the the extent to which changes in citizenship status affect levels of integration. • Two categories of indicators: • Labour force participation (2008 Eurostat LFS ad hoc module) • Social inclusion and standard of living (2008 Eurostat LFS ad hoc module & 2008 EU-SILC) • Sample: EU-27, Iceland, Norway, Switzerland • As expected, immigrants who naturalised are often better off than immigrants who have not naturalised.
Labour Force Participation UNEMPLOYMENT RATE ECONOMIC ACTIVITY RATE OVERQUALIFICATION RATE The gap in unemployment between foreign-born non-citizens and native-born citizens in Spain is among the largest in our sample.
Labour Force Participation UNEMPLOYMENT RATE ECONOMIC ACTIVITY RATE OVERQUALIFICATION RATE Naturalized immigrants have lower levels of unemployment than non-citizen immigrants. Immigrants from outside the EU have higher levels of unemployment than immigrants from within the EU. Source: 2008 EU Labour Force Survey Ad Hoc Module
Social Inclusion & Standard Of Living • EDUCATION LEVEL • DWELLING & AREA QUALITY • PROPERTY OWNERSHIP • HOUSING COST BURDEN • RECEIPT OF SOCIAL BENEFITS • DIFFICULTY MAKING ENDS MEET • UNMET HEALTHCARE NEEDS Generally, the gaps between the share of immigrants and the share of natives having difficult paying household expenses are larger in Spain than across the EU. Source: 2008 EU-SILC Survey
Social Inclusion & Standard Of Living • EDUCATION LEVEL • DWELLING & AREA QUALITY • PROPERTY OWNERSHIP • HOUSING COST BURDEN • RECEIPT OF SOCIAL BENEFITS • DIFFICULTY MAKING ENDS MEET • UNMET HEALTHCARE NEEDS Immigrants in Spain spend a larger portion of their income on housing expenses than natives. The gaps between natives and immigrants are larger in Spain compared to the averages for the EU-15 and EU-27. Source: 2008 EU-SILC Survey