Download
1 / 21
210 likes | 308 Views
VEGA Visual Environment for Gravitational waves data Analysis. D. Buskulic / LAPP Annecy ROOT 2000 Workshop. Outlook. What is a Gravitational Wave ? How to detect it ? Example : VIRGO Data Handling : Similarities/Differences with HEP VEGA : an environment based on ROOT Strengths

E N D
VEGAVisual Environmentfor Gravitational waves dataAnalysis D. Buskulic / LAPP Annecy ROOT 2000 Workshop
Outlook • What is a Gravitational Wave ? • How to detect it ? Example : VIRGO • Data Handling : Similarities/Differences with HEP • VEGA : an environment based on ROOT • Strengths • Weaknesses and problems • Conclusion
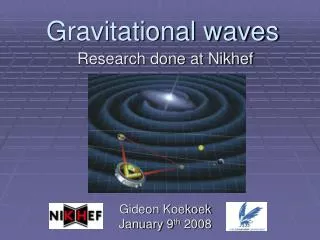
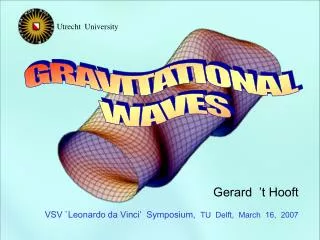
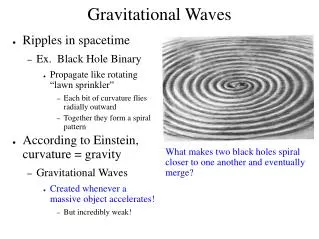
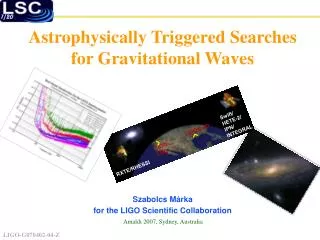
What is a Gravitational Wave ? • Very small deformations of space time • Amplitude h = DL/L < 10-21 (1 = flat space) • Travelling (waves) at the speed of light • Generated by cosmic events : • Supernovae, Coalescing binary neutron stars, Formation of black holes... • Gives new insights in fundamental Physics and Astrophysics
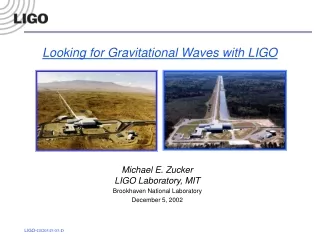
How to detect it ? • One way : • Resonant bars • Another way : • Measure time of flight of a light beam : Michelson Interferometer
How to detect it ? (II) • Principle: • Detect the difference in light travel time between the two arms (interferometry) • GW travelling along z axis • changes distance in x and y : change in x is opposite to change in y and oscillating
Example : VIRGO • Located in Cascina, near Pisa, Italy • Arms length : 3 km • Sensitivity zone : 10 Hz-1 kHz • Sensitivity max : • Begins running in 2002
Data Handling : Similarities/Differences with HEP • Data flux : 7.6 MB/s -> 150 - 200 TB/year (few channels, continuous recording) • Online selection -> 3 TB of selected data • Main difference with HEP : no events, but data have a temporal link • Definition of a specific data format : the Frame • 1 Frame = data chunk of 1 sec of interferometer running
VEGA : an environment based on ROOT • Evaluated by the VIRGO experiment • User interaction : use ROOT facilities • Data access : the metadatabase • Signal processing/analysis • Graphics
VEGA : the metadatabase • Data stored in Frame format • Time is the main access parameter • Need to access simply any vector/frame • Build a database containing metadata (data about data) • Indexes a set of Frame files
VEGA : the metadatabase (III) • Performances : • Tested with 105 files, 1 frame each • If 100 frames/file, simulates 107 frames in terms of memory and speed (3 months of VIRGO data) • Memory : ~ 500 MB to index ~ 1 TB of data • Speed : Metadatabase overhead in access time = 2% of frame access time on average
VEGA : Signal processing/analysis • Plan to use VIRGO data analysis library • Basic signal analysis • FFT, Convolution, Filters • Standard VIRGO analysis tools for GW signals • Need 100s of GFlops of computing power, use of PROOF ?
VEGA : Graphics • Time is everywhere in GPS format : • Today 14:00:00 is GPS 633618013 ! • Need a reference time • Added time on the axis into ROOT • Not perfect but works • Use of plots with large number of points (>105)
Weaknesses/Problems (T) = Technical problem • (T) Time on the axis still has problems, related to the way axis are drawn • (T) Numbers (time) on the axis grow rapidly • May want to display 1 sec of data going from 1000000 to 1000001 • problems in graphics in that case
What people dislike • Interactivity • Finding the right object is not natural (though logical) • For one histogram -> five objects in a pad • Enhance popups with info on neighboring objects ? • (T) Histogram is hard to pick with mouse when large number of points • TPaveStats::SetStat(111) : Meaning of 111 in dialog… ? See point about doc and help
What people dislike (II) • The Interpreter • Sometimes dereferencing 0 gives a segfault • If segfault, no core, no info where it happened (macro line) • But less complaints about the interpreter • Graphics • Axis on the right are not intuitive to draw-> Doc in TGaxis, people search in TAxis
What people dislike (III) • The class doc contains almost everything but… • Finding a piece of info is not trivial • No reference where to search • Examples • Greek letters-> TPostscript or TLatex or TText ? • Axis -> TGaxis or TAxis ? • You have to know the name of the class, not trivial for beginners • Sometimes three classes to find one info
What people like • Tab completion • Interactivity (zoom, changing properties of objects…) • The Interpreter • … and many more !
Strengths of ROOT for us • We hope connection with batch is simplified thanks to the interpreter • Frame access is fast through the metadatabase • Keep the Frame format • Consistency across the whole data analysis
All in All... • VEGA is based on ROOT, and happy like this ! • Also based on the Framelib managing Frame files • Consistency through the analysis • For the language • For the input/output http://wwwlapp.in2p3.fr/virgo/vega