Download
1 / 33
330 likes | 455 Views
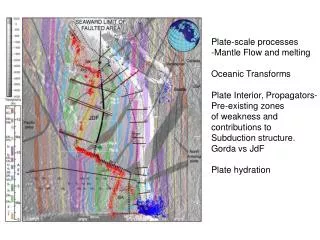
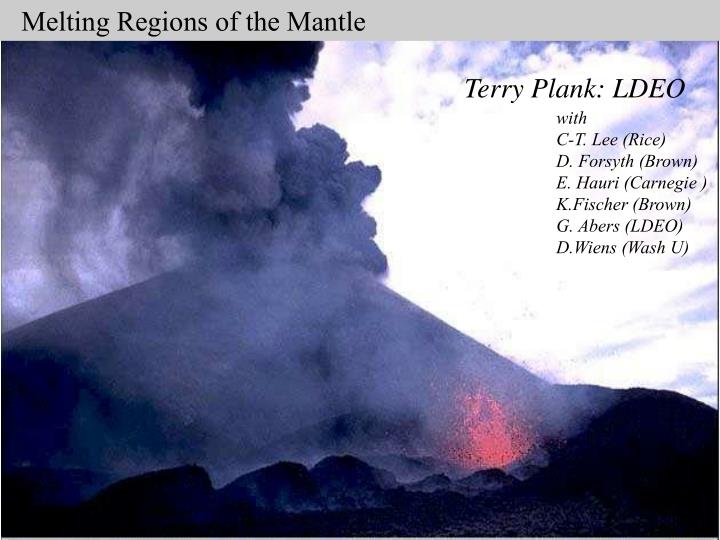
Melting Regions of the Mantle. Terry Plank: LDEO. with C-T. Lee (Rice) D. Forsyth (Brown) E. Hauri (Carnegie ) K.Fischer (Brown) G. Abers (LDEO) D.Wiens (Wash U). Boundary Layers and Melting. Boundary layer dynamics drive melting. melt extraction creates lithosphere.

E N D
Melting Regions of the Mantle Terry Plank: LDEO with C-T. Lee (Rice) D. Forsyth (Brown) E. Hauri (Carnegie ) K.Fischer (Brown) G. Abers (LDEO) D.Wiens (Wash U)
Boundary Layers and Melting Boundary layer dynamics drive melting melt extraction creates lithosphere b.holtzman 2009
East Pacific Rise MELT Experiment Forysth et al (1998) Japan Volcanic Arc P-wave tomography Zhao et al (1992)
Southern California shear velocity anomaly (70-90 km depth) from Yang and Forsyth, 2006, JGR Hot ? Wet? Melt ? What does RED mean?
Melt Thermobarometers MgOol olivine-melt thermometer D = = f (T) +/- 30 °C MgOliq Temperature (°C) 1100 1200 1300 1400 1500 0 dry solidus 1 40 km Pressure (GPa) 70 2 3 100 Solidus from Hirschmann (2000)
Melt Thermobarometers MgOol olivine-melt thermometer D = = f (T) +/- 30 °C MgOliq Temperature (°C) 1100 1200 1300 1400 1500 0 Mg2SiO4ol + SiO2liq = Mg2Si2O6opx dry solidus 1 40 km a(SiO2)liq ~ 1/K Pressure (GPa) 70 2 silica-melt baromometer 3 100 +/- 0.2 GPa Thermobarometer parameterizations from C-T Lee et al, EPSL, 2009 Solidus from Hirschmann (2000)
Melt Thermobarometers MgOol olivine-melt thermometer D = = f (T) MgOliq Temperature (°C) 1100 1200 1300 1400 1500 0 Mg2SiO4ol + SiO2liq = Mg2Si2O6opx dry solidus 1 40 km a(SiO2)liq ~ 1/K Pressure (GPa) 70 2 silica-melt baromometer 4.5 wt% H2O 3 100 Thermobarometer parameterizations from C-T Lee et al, EPSL, 2009 Solidus from Hirschmann (2000)
For H2O, we need melt inclusions in olivine from well-quenched tephra
Examples of Melting Regions 1. East Pacific Rise 2. Back-arc Basins 3. Central American Arc 4. Basin and Range
East Pacific Rise (MELT and GLIMPSE) Ridge Shear velocity model Harmon, Forsyth, Weeraratne (EPSL, 2009)
method in LKP92 and Wiens et al (2006) 100 ppm H2O Pacific off-axis Nazca off axis on-axis Temperature (°C) 1100 1200 1300 1400 1500 1600 0 oceanic crust 15 km 1 50 km 2 Pressure (GPa) 80 km 3 110 km 4 P-T calculated from thermobaromters in Lee et al (EPSL, 2009): Fo90, 100% Fe2+; H2O = 0.1 wt% Most MORB data from Sinton et al (JGR, 1991) and Hall et al (G3, 2006); all > 8.2 wt% MgO
Ridge Tp = 1470°C magmas dry solidus solidus with 100 ppm H2O Shear velocity model Harmon, Forsyth, Weeraratne (EPSL, 2009)
Tp = 1470°C Tp = 1470°C Ridge Temperature (°C) % Melting magmas 0 10 20 1300 1400 1500 0 40 dry solidus 80 solidus with 100 ppm H2O 120 km 0 50 100 ppm H2O km Shear velocity model Wet melting model after Langmuir et al (2006) Harmon, Forsyth, Weeraratne (EPSL, 2009)
test dynamic models From Conder et al (JGR, 2002)
0 derived from Rayleigh waves 50 Depth (km) melt? Model that satisfies Q = 80; Tp = 1350°C 100 …or Tp = 1450°C 150 200 3.8 4.4 4.0 4.6 4.8 4.2 Shear velocity (km/s) After Yang & Forsyth (EPSL, 2007)
2. Back-arc Basins Wiens, Kelley & Plank (EPSL, 2006)
(dry melts only) Mariana Tr. & Scotia N. Lau & N. Fiji S wave velocity (km/s) MELT Wiens, Kelley & Plank (EPSL, 2006)
Temperature variations on Vs S.EPR (MELT)? Wiens, Kelley & Plank (EPSL, 2006)
3. Volcanic Arc Syracuse, Abers, Fischer, MacKenzie, Rychert, Protti, Gonzalez, Strauch (G3, 2008) Rychert, Fisher, Abers, Plank, Syracuse, Protti, Gonzalez, Strauch (G3, 2008)
Syracuse, Abers, Fischer, MacKenzie, Rychert, Protti, Gonzalez, Strauch (G3, 2008)
Rychert, Fisher, Abers, Plank, Syracuse, Protti, Gonzalez, Strauch (G3, 2008)
Olivine-liquidus depression due to water from Medard and Grove (2007))
US Array: Transportable Array
70-90 km depth LV = Long Valley BP = Big Pine GT = Golden Trout C = Coso from Yang and Forsyth, 2006, JGR from Deuker et al, 2001, JGR
Yucca Mnt Lathrop Wells volcano 70,000 yrs old 18 km south of Yucca Mnt
Mantle Melting Profile Across B&R dark green columns = + ε(Nd) (astheno.) Wang, Plank, Walker and Smith, JGR, 2002
Transect at 37°N 0 km 50 100 150 112 114 116 118 120°W Courtesy of Yingjie Yang (Yang, Ritzwoller, Lin, Moschetti, Shapiro, JGR, in press)
Transect at 37°N 0 km 50 BP 100 150 112 114 116 118 120°W Courtesy of Yingjie Yang (Yang, Ritzwoller, Lin, Moschetti, Shapiro, JGR, in press)
Transect at 37°N 0 km 1200-1340°C 1.8 wt% H2O 50 BP 1445-1460°C 0.9 wt% H2O 1365-1390°C 3.2 wt% H2O Tp=1350 SC LW 100 Tp=1440 Tp=1390 150 112 114 116 118 120°W Courtesy of Yingjie Yang (Yang, Ritzwoller, Lin, Moschetti, Shapiro, JGR, in press)
Examples of Melting Regions 1. East Pacific Rise presence of melt 2. Back-arc Basins mantle Tp variations 3. Central American Arc effect of water on Q 4. Basin and Range mapping T, melt and H2O