Download
1 / 26
260 likes | 408 Views
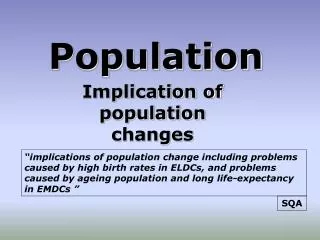
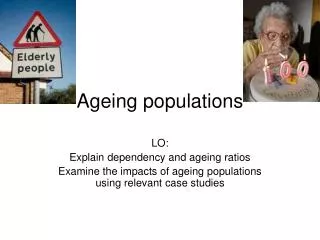
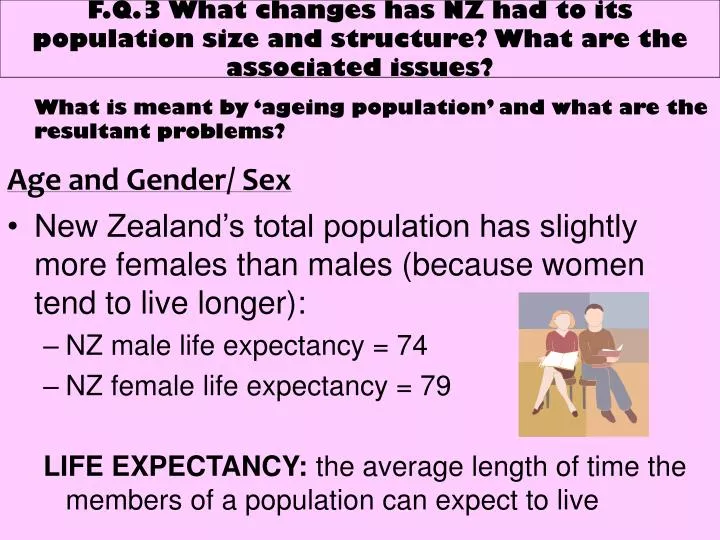
F.Q.3 What changes has NZ had to its population size and structure? What are the associated issues?. What is meant by ‘ageing population’ and what are the resultant problems? Age and Gender/ Sex

E N D
F.Q.3 What changes has NZ had to its population size and structure? What are the associated issues? What is meant by ‘ageing population’ and what are the resultant problems? Age and Gender/ Sex • New Zealand’s total population has slightly more females than males (because women tend to live longer): • NZ male life expectancy = 74 • NZ female life expectancy = 79 LIFE EXPECTANCY: the average length of time the members of a population can expect to live
The AGE-SEX structure of a population can be presented as a ‘population pyramid’: • Horizontal bar graph • Divided into 5 year age groups • Separates male and females
Dependency • A population can be divided into 3 groups: • 0-15 Youth • 16-64 Working age group • 65+ Elderly/ senior citizens • 0-15 dependent population 65+ • Why are they dependent? • 0-15 rely on their parents to look after them • 65+ depend on the working age group to pay tax = how a pension is paid
PENSION: a regular income paid to an individual by the government • So…more dependents = more money the working age group has to pay …problem? • New Zealand’s population is aging: this means that the percentage of people of 60 is increasing = more people that need pensions!
Population pyramid analysis • The most important pattern in an Age-Sex pyramid is the comparison of the working age group to the dependent age groups • Geographers will look at bulges and dips to forecast how a population will change • Population pyramids also give information about the proportions of males and females at different ages
China's Population by Age & Sex, 1950 - 2050 (population in 1000) • http://www.google.co.nz/imgres?imgurl=http://www.iiasa.ac.at/Research/LUC/ChinaFood/images/anim/ch_all2.gif&imgrefurl=http://www.asia-expatsforum.com/phpBB2/china-s-population-by-age-sex-vt4533.html&h=404&w=399&sz=47&tbnid=Srq9MBAPn_B5dM:&tbnh=124&tbnw=122&prev=/images%3Fq%3DNew%2BZealand%2Bpopulation%2Bpyramid&hl=en&usg=__k0NOdqrh4aISK2ajK7fWcxUQGg8=&ei=vs2tSvuDL4_6kAXLxb2VBg&sa=X&oi=image_result&resnum=7&ct=image
The median age (half are older, and half are younger, than this age) of usual residents was 35.9 in the 2006 Census. In 1996, the median age was 33.0 years. This increase in the median age reflects New Zealand's ageing population. • The median age for males was 35.1 years, while the median age for females was 36.7 years. This reflects a longer life expectancy for women than for men. • There were 531 people aged 100 years or over at the time of the 2006 Census – around three-quarters were women. • Most of the increase in the usually resident population between 2001 and 2006 came from those in the working-age group of 15 to 64 years (up 225,657 or 9.3 percent). • The proportion of people under 15 years of age decreased from 22.7 percent in 2001 to 21.5 percent in 2006. • There was little change in the proportion of the population aged 65 years and over – this was 12.1 percent in 2001, and 12.3 percent in 2006.
Important terms and statistics • Birth rate means the number of births per 1000 females: • Our current birth rate is 14/ 1000 • Death rate means the number of deaths per thousand people: • Our current death rate is 7/ 1000 • Life expectancy means the average age people are expected to live to: • Males: 79 years of age • Females: 83 • Infant mortality means the number of deaths in infants (under 1) per thousand live births: • 5/ 1000 • Fertility rate means the average number of children born to a woman who lives beyond her childbearing years (15-49): • 2.1
What does an ageing population mean? • This means the percentage of people in the elderly age group is increasing and This group is becoming out of proportion with the working age group. This is called the dependency ratio: A ratio indicating the number of dependents (aged 0-14 and over the age of 65) to the working age population (aged 15-64).
Problems of an ageing population • More people = more needs: • Housing: small, one storey, low maintenance, easy access • Medical: more and geriatic facilities • Public buildings/ facilities: escalators, elavators, elderly shopping centres When these things are needed there will be LESS people in the working age group (those paying tax) so…NOT ENOUGH MONEY!
Why is our population ageing? Three reasons: • Dropping birth rates and fertility rates TASK: complete activities on page 34 of the population studies textbook (*or the task on the next slide)
Of course I want a bigger and better house but how can we pay the mortgage if we have children We will have to stop at two. It’s not right to have more children than will replace us. The world’s population is too big as it is. Let’s have two children. We’ll have the first next year and the second three years later. Yes, I agree one child will be enough. Then we can provide her with the best education and give her a quality lifestyle. It’s your choice. Do you want another child or go on a trip to Europe next year> Now that the family benefit has gone we simply can not afford to have more children Why should I? My career is just as important as yours. You stay at home and look after children if that’s what you want. TASK: Using the information in the speech bubbles below, list why birth and fertility rates are declining
Women are waiting longer to have children, on average having children 5 years later than women in the early 1970’s WHY? • Urbanisation: apartments and small inner city houses not suitable for families • A more affluent (means wealthy, successful) society has led to women changing their priorities: • Changing status in the workplace • working longer to establish a home • Improved access to education • developing careers • Changing social role: not just ‘mothers/ housewives’ • and contraception more acceptable/ available So…House comes 1st, then car, then lifestyle (travel, material items), then KIDS!
TASK: compare the population pyramids above and answer the following questions
Example: fertility rates • 1961 = 4.3 births per woman • 2004 = 2.0 births per woman • Baby boomers! • After WWII between 1945-1964 there was a baby boom • This resulted in a youthful population which has been good whilst the baby boomers are in the working age group BUT… • Now baby boomers are reaching retirement!
People are living longer • Death rates have been steadily declining (except war years) • Technology in healthcare, less strenuous work and lifestyle
Population Growth • Population growth is the percentage increase in the total population in 1 year • A population can grow in 2 ways: • By it’s own growth which is called natural increase (births- deaths) OR • Immigration: people moving into the country • Apart from the baby boom, NZ’s natural increase has been dropping since 1900
Voluntary saving for retirement • Superannuation is a savings scheme or system where money is placed in a fund to provide for a person’s retirement • Pension is a form of superannuation • Kiwi saver is a form of superannuation. It is a voluntary, work-based savings scheme. It is a Government initiative that is designed to increase the level of savings by New Zealanders.
Emigration of young adults O.E’s • What is an O.E? • Are you planning on travelling when you’re older? If so, where do you want to go? • Why would you consider going overseas? • Would you like to live permanently overseas? The emigration of young adults (often referred to as the ‘brain drain’) is contributing to our ageing population
What’s the solution to our ageing population...MIGRATION? GOVERNMENT IMMIGRATION POLICY Do I need a visa? How long can I stay? Can my family come later? COST OF TRAVEL Where can I afford to move to? (flights, moving belongings etc) WAR/ CONFLICTwhat are some countries you wouldn’t travel to due to war? Factors affecting migration SOCIAL FACTORS Lifestyle of destination? Climate? Support networks? ECONOMIC CONDITIONS Are there jobs available? Are there benefits available if I lose my job?
Are people coming here? • Since 1970 net migration losses have been more frequent Terms: Internal migration: movement within a country External migration: movement between countries Net migration: immigration minus emigration TASK: calculating net migration
To boost population growth, the government has tried to attract greater numbers of immigrants, especially: • Young people • Well educated people • Wealthy people • NZ traditionally received immigrants from Britain and other English speaking countries NZ was criticised for having a ‘white-only’ policy
So… migrants now come from more countries • But even with these changed immigration policies we have still not been successful because… • Increased emigration to Australia • Political opposition in NZ to Asian immigration (Winston Peters!) • Not providing jobs for immigrants • Some important questions need to be asked…How large a role should governments have in looking after the elderly?
Solutions? The options are: • Government continues to provide for the elderly working age people pay greater taxes • working age people save a lot more for their old age • Individuals provide for their own old age • Families take responsibility for looking after their elderly working age people have less to spend on themselves and their children