Download
1 / 19
190 likes | 308 Views
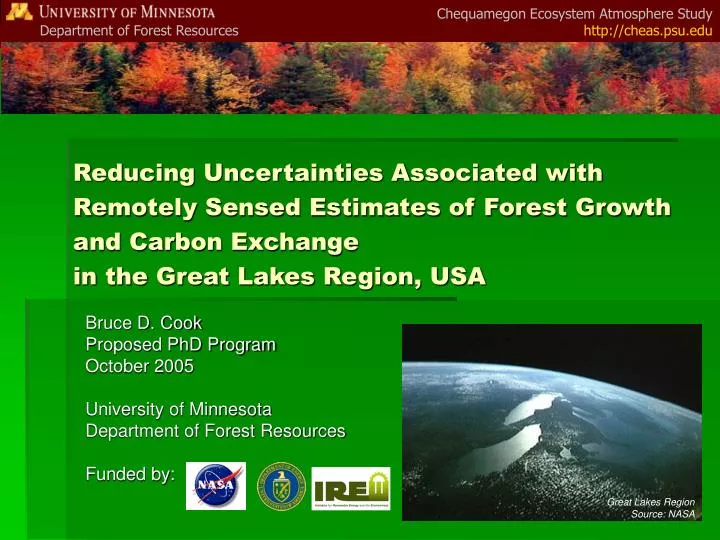
Chequamegon Ecosystem Atmosphere Study http://cheas.psu.edu. Department of Forest Resources. Great Lakes Region Source: NASA. Reducing Uncertainties Associated with Remotely Sensed Estimates of Forest Growth and Carbon Exchange in the Great Lakes Region, USA. Bruce D. Cook

E N D
Chequamegon Ecosystem Atmosphere Study http://cheas.psu.edu Department of Forest Resources Great Lakes Region Source: NASA Reducing Uncertainties Associated with Remotely Sensed Estimates of Forest Growth and Carbon Exchange in the Great Lakes Region, USA Bruce D. Cook Proposed PhD Program October 2005 University of Minnesota Department of Forest Resources Funded by:
PhD Research Goals • Up-scale terrestrial plant growth and C exchange for the region using process-based models driven by remotely sensed variables and interpolated meteorology and hydrology. • Identify, quantify, and reduce sources of uncertainty.
PhD Research Topics Errors associated with poor state data(e.g., land cover). Model logic errors in wetlands ecosystems. Parameterization errors associated with disturbance. Alternative model inputs for reducing uncertainties (e.g., FPAR derived from LiDAR)
Spring Summer Background • MODIS imagery and growth algorithms
19 June 2003 Moderate-Resolution Imaging Spectroradiometer (MODIS)
MODIS Gross Primary Production Algorithm GPP = APAR × e APAR = Absorbed Photosynthetically Active Radiation e = Light-Use efficiency parameter Thesis Question: How well does MODIS approximate APAR and e, and can this be improved?
MODIS-derived FPAR Meteorological data (NASA-DAO) GPP = APAR × e Absorbed PAR APAR = FPAR × ↓PAR FPAR = fraction of incoming PAR absorbed by plants ↓PAR = incoming PAR
“Main” Radiative Transfer Algorithm Compares observed and modeled surface reflectances for a suite of canopy structures and soil patterns. “Backup” Algorithm Look up table of NDVI-FPAR relationships for different land cover types. Shabanov et al. http://cliveg.bu.edu/modismisr/index.html GPP = (FPAR × ↓PAR) × e MODIS FPAR and LAI
GPP = (FPAR × ↓PAR) × e TERRA and ASTER composite Quality Control Shabanov et al. http://cliveg.bu.edu/modismisr/index.html Main Saturation Back-Up Quality Control Sources of FPAR Errors Clouds • Favor backup algorithm Snow cover • Neither method is satisfactory Reflectance saturation • Typical over woody vegetation Land cover uncertainties • Largely unknown
Gap Fraction LAI and FPAR P0 = Probability of light pulse reaching the ground L = Leaf area index (LAI) Ω = clumping factor (0 to 1) G = Directional cosine between light source and leaf normal Θ = zenith angle of light source
2,3 4 1 5 6 7 ChEAS Surface Water Monitoring Network ID/SITE NAME • Alder micromet station • Lost Creek flux tower I • Lost Creek flux tower II • Forested wetland • South Fork • Wilson Flowage • Willow Springs
Geographically Isolated Wetlands Alder micromet station - alder, white cedar - installed 2000 Forested wetland - tamarack, white cedar - installed 2005 (Tier 3) South Fork - ericaceous species - installed 2005 (Tier 3/4)
Riparian Wetlands Lost Creek flux tower I - alder, willow, sedge - installed 2001 Lost Creek flux tower II - alder, willow, sedge - installed 2005 (Tier 3) Wilson Flowage - wet meadow - installed 2005 (Tier 3/4)
Spring-Fed Wetland Willow Springs - wet meadow - installed 2005 (soil efflux)
Lost Creek ChEAS Flux Tower Little Bear Creek USGS Streamflow Monitoring Station Bear River Water Table vs. Local Stream Flow
Long-Term Precipitation Trends Source: Minocqua NCDC weather observation station.