Download
1 / 33
340 likes | 477 Views
Single Cell Biosensor. Allan Fierro David Sehrt Doug Trujillo Evan Vlcek Michael Bretz. Fabrication. Flow Control. Introduction. Optical Detection Circuit. Allan Fierro. Cell Trapping. What is Flow Cytometry?. Technique for counting cells Examining cells Sorting cells.

E N D
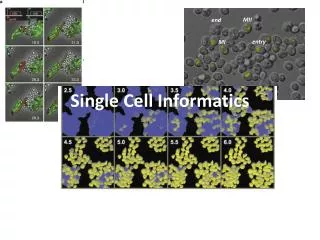
Single Cell Biosensor Allan Fierro David Sehrt Doug Trujillo Evan Vlcek Michael Bretz
Fabrication Flow Control Introduction Optical Detection Circuit Allan Fierro Cell Trapping
What is Flow Cytometry? • Technique for counting cells • Examining cells • Sorting cells
Example of Flow Data Analysis of a marine sample of photosynthetic picoplankton by flow cytometry showing three different populations (Prochlorococcus,Synechococcus and picoeukaryotes)
What is Optofluidics? • Optofluidics combines microfluidics and optics • Able to see the difference in light refraction wavelength wavelength *diagrams courtesy of L. Shao, Ph.D. from Ph.D. Defense Presentation
Flow Cytometry vs. Optofluidics Flow Cytometry Optofluidics • Flow uses scatter of light • Flow more expensive to run • Flow samples take longer to prep • Can’t use cells after • Optofluidics uses refraction of light • No fluorescent dye - cheaper and less prep time • Optofluidics can keep cells after
Microscope Light Cell Infrared LED
Fabrication Flow Control Fabrication Optical Detection Circuit David Sehrt Cell Trapping
DEP Chip Images courtesy of Weina Wang
DEP Chip Processing 1. 30 nm Chrome Deposition 2. 120 nm Gold Deposition 3. Spin Photoresist 4. Exposure 5. Development 6. Gold Etch 7. Chrome Etch 8. Resist Removal
PDMS Channel • PDMS- Polydimethylsiloxane • Suitable optical properties • Adhesive to glass • Channel mold made of a silicon substrate and SU-8 Photoresist • PDMS poured into mold and baked to form elastic solid
DEP PDMS Bonding • Oxygen-plasma treated • Bonding is performed with a mask aligner • Minute Pressure is applied for bonding to transpire DEP Chip PDMS Channel
Fabrication Flow Control Flow Control Optical Detection Circuit Evan Vlcek Cell Trapping
Two drilled holes at each end Nanoports for each hole 200 µm wide, 25 µm deep, channel Need flow rate of approximately 40 µm/s Chip Design for Fluid drilled hole 200 µm chip channel flow nanoport *picture courtesy of L. Shao, Ph.D. from Ph.D. Defense Presentation
Nanoport Assembly TOP VIEW SIDE VIEW chip nanotube nanoport drilled hole adhesive o ring adhesive o ring from pump “waste” nanoport nanotube
Block Diagram DB9 RS-232 Labview program Oriel Controller Actuator Syringe Nanotube Chip Yes Yes Set Parameters Pump? On Cycle Off Cycle Stop? Stop Pump No
Actual Setup • Pump set to move actuator 0.5 µm/s • On for 0.825 s, off for 7 s (≈10.5% duty cycle) • π cm2 syringe area * 0.5 * 10-4 cm/s * 0.105 1.66 * 10-5 cm3/s through channel • This is 1.43 liters being pumped through the channel every 24 hours! Oriel Controller actuator 0.5 µm/s RS 232 syringe Labview VI nanotube
Actual Setup Labview program actuator syringe Oriel controller
Fabrication Flow Control Optical Detection Circuit Optical Detection Circuit Doug Trujillo Cell Trapping
Optical Detection of Cells • -Implementation- • Photo diode coupled via fiber optic cable from microscope to detect light modulation • Monitor the change of the reverse bias current from the diode through the use of a USB Data Acquisition unit • Digital switch to trigger RF traps -Purpose- Detect the presence of a cell in proximity of a trap Interface with the pump flow controller Provide triggering for the RF traps
Optical Detection of Cells -Requirements- • Able to detect light modulation of cells traveling 40 µm/sec • Output a voltage in the range of 2V - 3.8V. Any higher voltage output may damage the DAQ • Photodiode must be responsive to light source of 860-910 nm Circuit Design Flow Chart Microscope output Photo Diode Low pass filter Signal to DAQ Amplifier Buffer
Optical Detection of Cells -Light Source- The light source is set up as shown in the figure. The LED is a high-intensity Infrared LED. Lear, Kevin L., Hua Shao, Weina Wang, and Susan E. Lana. "Optofluidic Intracavity Spectroscopy of Canine Lymphoma and Lymphocytes." IEEE Explore (2007). 4 Dec. 2007. 50/125 multimode fiber beam-splitter micro-fluidic sample DAQ DAQ Circuit Circuit Labview Labview Traps Traps infrared source LEDs
Optical Detection of Cells -Circuit Design- ~2mV Output from Diode A1 signal to USB DAQ
Optical Detection Rise Time: 128 µs Peak Voltage: 2.7 V Figure of Time Response of Optical Detection Circuit
Fabrication Flow Control Cell Trapping Optical Detection Circuit Michael Bretz Cell Trapping
Automated Trapping Analog Output Digital Output Data Acquisition Unit Detection Circuit Triggering Circuit AC Signal The digital signal from the Data Acquisition Unit is input into an ADG-452 (basically a digital switch) chip. This allows an AC signal to be applied to the DEP traps DEP Traps
Dielectrophoretic(DEP) Trapping • Uses theory of electromagnetics to trap cells • A non-uniform electric field causes polarization within individual molecules of spheres/cells. • This polarization along with electric field apply a force that will move spheres to a desired location. Electric field
Ground fluid flow +AC Voltage Electromagnetic modeling Picture Courtesy of Weina Wang et al. powerpoint presentation “Lab-on-a-Chip Single Particle Dielectrophoretic (DEP) Traps” 3-6-2006. The force caused by the electric field will push the spheres into the center of the trap.
Requirements Sphere must be traveling at 40 micron/second or less Signal used to generate the electric field must be a time varying signal in order to produce a non-uniform electric field. Signal used to generate the electric field must have an amplitude greater than 5 Volts peak to peak Both of these requirements are necessary in order for the for the force caused by the electric field to overcome the force caused by the flow of water. i.e. an object in motion stays in motion unless acted upon by a net external force.
Budget • ADG 452 Digital Switch -- $15 • Various circuit elements -- $10 • Hytek iUSBDAQ U120816 -- $105 • TOTAL EXPENSES = $130
Future Work • Improve glass chip fabrication process • Fine-tune optics for better optical detection • Incorporate spectrometer and automate data acquisition • Research best trap design to allow for faster flow rate • Explore methods to allow for cells to be analyzed faster