Download
1 / 31
410 likes | 884 Views
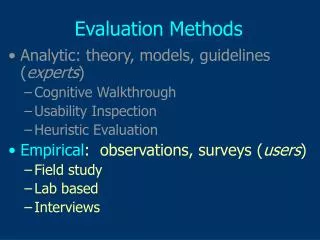
Evaluation Methods. Analytic: theory, models, guidelines ( experts ) Cognitive Walkthrough Usability Inspection Heuristic Evaluation Empirical : observations, surveys ( users ) Field study Lab based Interviews. Empirical Evaluations: Validity. Conclusions based on actual use, BUT...

E N D
Evaluation Methods • Analytic: theory, models, guidelines (experts) • Cognitive Walkthrough • Usability Inspection • Heuristic Evaluation • Empirical: observations, surveys (users) • Field study • Lab based • Interviews
Empirical Evaluations: Validity • Conclusions based on actual use, BUT... • Are the users representative? • Is the test population large, diverse enough? • Is the test system realistic (versus early prototype)? • Do the tasks match what happens in real use? • Do the data (measures) reveal real life impacts? • These are the general concerns of “ecological validity”, the extent to which an investigation is a genuine reflection of real-world happenings
Field Studies • Variants of ethnographic methods we discussed during requirements analysis • Observation of realistic tasks, interviews, data files, etc. • Avoids the problem of ecological validity • Summarize data through content classification • e.g., problem categories, problem scenarios • Can also sort by severity, based on observed impacts • Field data collection and analysis time-consuming • Also, much of the data simply reveals successful use!
Interviews, User Introspection • Ask users to report what stands • More efficient access to data of interest: critical incidents • Can enhance by making this collaborative, a discussion among usability personnel and multiple stakeholders • BUT, human memory is biased • Wanting things to make sense • Assuming things work as they always have
Usability Evaluation in the Lab • Carefully selected set of representative tasks • e.g., based on task analysis of the system, design goals • In SBD, claims are used to guide task selection • Control aspects of situation that are uninteresting • e.g., experimenter, location, task order, instructions • Collect multiple measures of usability impacts • Performance (time and errors), output quality • Satisfaction ratings or other subjective measures • Interpretation comes back to validity of the test • Both ecological (realism) and internal (controls)
Controlled Experiments • If asking a specific question, making a choice • Operationalize independent and dependent variables • What is manipulated, what outcomes are measured • Define hypotheses in advance of the test • Causal relation of independent and dependent variables • Testing these requires the use of inferential statistics • Construct an effective and practical design • Within-subjects or between-subjects testing conditions • How many people to test, how assign to conditions
Some Variations • Usability testing with think-aloud instructions • Users comment as they work on their current goals, expectations, and reactions • BUT, thinking aloud takes capacity, changes task itself • Very useful in supporting formative evaluation goals • Storefront testing: bring the prototype into the hall! • Fast, easy, quick cycle...but no control of users, tasks • All of these can (should!) be supplemented with interviews and/or user reaction surveys • Objective measures of behavior not always correlated with subjective measures of experience or satisfaction
Conducting a Usability Test • Recruiting of test participants • Preparation of materials • informed consent, background & reaction questionnaires, general and task-specific instructions, data collection • Test procedures • before, during, after; including assistance policy • Summarizing and interpreting the results
Recruiting Test Participants • Who are stakeholders, which ones are actors? • May mean different users for different tasks • Or, may mean users role-playing other stakeholders • How do you get people to participate?! • Participatory design, but this has its own downsides • Offer stipends or other rewards • Make test seem interesting, emphasize novelty • Last resort, hire from a temp agency...
Informed Consent • Always an issue when human subjects involved • The history: psychological research that deliberately deceives people, engages them in moral dilemmas, or is potentially harmful • The fix: procedures must be approved by a committee • Ensures respect for individuals’ concerns and hesitations about participating • Full disclosure of procedures (except when necessary) • Clear statement of voluntary nature, participant’s rights • Signature indicating understanding and willingness
User Background Questionnaire • Characterize the user sample you end up with • Relevant experience, expectations, starting attitudes • The question: are these the users you need to test? • But also, helps to interpret test results • E.G., Experienced computer users will likely do better • Domain experts may be more critical, more specific • A range of questions but not too long • Personal, demographic, experience, current attitudes • Shoot for one page, seems less intimidating, tedious See p. 258 for a model to use in developing your own user background survey
Developing User Rating Scales • Convenient for gathering subjective reactions • often summarized numerically by mapping judgment categories to ordinal variable (e.g. 1—>5) • flexible, can be very general or specific • can use to examine opinion change (post-pre) • Likert scale: measures strength of agreement to an assertion about the system or task domain Shopping for groceries online is enjoyable. Strongly Disagree Strongly Agree Disagree Neutral Agree
Task Instructions • General instructions that introduce overall test • Two sorts of instructions, depending on test type • Open-ended and goal-directed, for scenario exploration • These participants will be doing think-aloud process • Usage context followed by very precise goals for subtasks • Clear specification of the user’s goal • Avoid options or ambiguities unless part of the test • No step-by-step scripts: you are testing the system, not your ability to write complete instructions! See p. 254 & p. 259 for models to use in developing your own instructions
Notice that these instructions make assumptions about system state at each point.
Planning for Data Collection • Be prepared: know in advance what and how • One evaluator interacts with the user, the other keeps track of what happens, collects times, etc. • A structured form or template can be very useful • Take advantage of tools if available and easy to use • Video taping, screen capture, event logging, etc. • Particularly useful when collecting think-aloud data • Know when and how to intervene if necessary • A three stage assistance policy: “try again”, “look here”, and finally “just do this: ...” • Be ready to prompt (“what just happened?”) for users in the exploratory think-aloud condition
User Reaction Questionnaire • Critical for gathering subjective reactions • For small tests, interviews can also be very useful • Similar in structure to background questionnaire • But no demographics this time • May include change in opinion due to test experience • Specific rating scales tied directly to target outcomes in the usability specifications • The “three best” or “three worst” features • Don’t forget the “anything else?” at the end See p. 261 for model to use in developing your own instructions
Statistics • t-test • Compares 1 dep var on 2 treatments of 1 ind var • ANOVA: ANalysis Of VAriance • Compares 1 dep var on n treatments of m ind vars • Result: “significant difference” between treatments? • p = significance level (confidence) • typical cut-off: p < 0.05
Statistics in Microsoft Excel • Enter data into a spreadsheet • Go to Tools…, Data Analysis… (may need to choose Analysis Toolpak from Addins first) • Select appropriate analysis
t-tests in Excel • Used to compare two groups of data • Most common is “t-test: two-sample assuming equal variances” • Other t-tests: • Paired two-sample for means • Two-sample assuming unequal variances
ANOVAs in Excel • Allows for more than two groups of data to be compared • Most common is “ANOVA: Single factor analysis” • Other ANOVAs: • ANOVA: Two-factor with replication • ANOVA: Two-factor without replication
p < 0.05 • Found a “statistically significant difference” • Averages determine which is ‘better’ • Conclusion: • Vis Tool has an “effect” on user performance for task1 • PerspWall better user performance than Lifelines for task1 • “95% confident that PerspWall better than Lifelines” • Not “PerspWall beats Lifelines 95% of time” • Found a counterexample to the null hypothesis • Null hypothesis: Lifelines = PerspWall • Hence: Lifelines PerspWall
p > 0.05 • Hence, same? • Vis Tool has no effect on user performance for task1? • Lifelines = PerspWall ? • Be careful! • We did not detect a difference, but could still be different • Did not find a counter-example to null hypothesis • Provides evidence for Lifelines = PerspWall, but not proof • Boring! Basically found nothing • How? • Not enough users (other tests can verify this) • Need better tasks, data, …
Reporting Results • Often considered the most important section of professional papers • Statistics NOT the most important part of the results section • Statistics used to back up differences described in a figure or table
Reporting Means, SDs, t-tests • Give means and standard deviations, then t-test • … the mean number was significantly greater in condition 1 (M=9.13, SD=2.52) than in condition 2 (M=5.66, SD=3.01), t(44)=3.45, p=.01
Reporting ANOVAs • … for the three conditions, F(2,52)=17.24, MSE=4528.75, p<.001 • F(x,y) -- F value for x between groups and y within groups degrees of freedom (df) • MSE -- mean square error for the between groups condition • p -- probability that difference occurred by chance
Making Sense of the Results • Relate to high-level goals: is the system useful, easy to learn and use, satisfying? • Which of these is hardest to judge in lab study? • But also compare directly to usability specs: • Did you miss, meet, or surpass the target level? • More importantly, can you figure out why? • Guidance on how to change design comes from the details of the testing, not the summary values • Why was user confused (or not), why was an interaction difficult or awkward, etc.
Usability Specifications • Quality objectives for final system usability • like any specification, must be precise • managed in parallel with other design specifications • In SBD, these come from scenarios & claims • scenarios are analyzed as series of critical subtasks • reflect issues raised and tracked through claims analysis • each subtask has one or more measurable outcomes • tested repeatedly in development to assess how well project is doing (summative) as well as to direct design effort toward problem areas (formative) • Precise specification, but in a context of use
Activity, information, and interaction claims: identify key design features to be tested Usability specifications: a list of subtasks with performance and satisfaction parameters Design scenarios: extract motivation and context for subtasks to be tested Estimates of behavior: published or pilot data of expected user behavior
A Sample Usability Specification • Where do targets come from? Serious, but not absolute • Notice that we can also “test” overarching scenario
What about Generality? • Salient risk in focusing only on design scenarios • may optimize for these usage situations • the “successful” quality measures then reflect this • When possible, add contrasting scenarios • overlapping subtasks, but different user situations (user category, background, motivation) • assess performance satisfaction across scenarios • Motivation to construct functional prototypes as early as feasible in development cycle