Download
1 / 31
310 likes | 418 Views
Scottish Index of Multiple Deprivation 2004 and Scottish Neighbourhood Statistics Robert Williams. Hope to cover today. Background to SIMD Results Can and can’t do General Scottish Executive Uses Introduction to SNS. Defining deprivation….

E N D
Scottish Index of Multiple Deprivation 2004 andScottish Neighbourhood StatisticsRobert Williams
Hope to cover today • Background to SIMD • Results • Can and can’t do • General Scottish Executive Uses • Introduction to SNS
Defining deprivation… • Deprivation “focuses on the lack of goods, services or social relations or inadequate physical or social environment which results from a lack of financial resources” • It is a relative measure where standards are defined in relation to social norms or expectations
SIMD Background • Long-Term Strategy- 2003 interim index developed by Oxford University- consultation by Scottish Centre for Research on Social Justice • Commitment to using better data, better geography and providing regular updates • Results in construction of an improved index over the next ten years
SIMD 2004 • Well respected methodology developed by Oxford University • 6 domains • Current Income, Employment, Health, Education, Access, Housing • 31 separate indicators
SIMD 2004 • New data zone geography • Splits Scotland into 6505 small areas • Ranking of small areas for each domain and by overall multiple measure • Identifies pockets of deprivation
Local Authority share of most deprived 15% of data zones across Scotland
Most Deprived 5% of data zones Most Deprived 15% of data zones
Uses of SIMD 2004 • SE’s official measure of area based multiple deprivation • Identify Scotland’s most deprived areas • Support funding allocations or bids • Look at emerging problems
Uses of SIMD 2004 • Help SE measure progress on a range of Closing the Opportunity Gap and portfolio targets on deprived areas • ‘To promote community regeneration of the most deprived neighbourhoods, through improvements by 2008 in employability, education, health, access to local services, and quality of the local environment.’ • Community Regeneration Fund
Community Regeneration Fund • £318m over 3 years (2005/2006 - 2007/2008) • Two thirds allocated to the most deprived 15% of data zones • Remaining third allocated to CPPs with above average (>15%) concentrations of deprivation • Transitional arrangements
Regeneration Outcome Agreement • Guidance issued 12 August • 80% of CRF funding targeted at the most deprived geographical communities • Up to 20% on thematic or group basis • Flexibility if strong case • Expect strong correlation with SIMD areas
What the indices don’t do Relative measure so don’t do: • Absolute difference between areas • Comparisons over time • BUT SIMD indicators and SNS can be used • Not a measure of ‘Most affluent’ • Not all living in deprived areas are deprived
Long term strategy • Developing existing domains • Developing new domains • Crime • Physical Environment • Other Financial Resources • Social Relations & Capital
Next SIMD • SIMD 2006 • Data zone population estimates from GROS • New and developed domains? • Data for housing domain? • Explaining change: SIMD 2004 and 2006
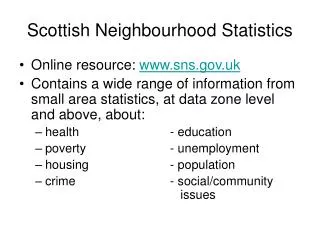
Introduction to SNS • Programme to improve small area statistics • 2001 Onwards • Data supports a number of the SE’s commitments • Those with small area emphasis – Closing the Opportunity Gap – Area deprivation: SIMD • Access to Central Government information will improve policy development at a local level
Deprivation Population Housing Education Health Community care Labour market Benefits Access Physical Environment SNS Data Development Data zone is the key geography
Access to SNS • Freely available over Internet • SNS Data Download CD • SNS Geography CD
SNS Statistical Analysis • SNS Tabular outputs • SNS Thematic mapping outputs • Analysis based on SNS and SIMD
Edinburgh North and Leith: View data in tabular format
View data in thematic map format: Percentage of the population on key income benefits and credits
Further Information • SNS www.sns.gov.uk • SIMD 2004www.scotland.gov.uk/SIMD2004Mapping • Closing the Opportunity Gapwww.scotland.gov.uk/closingtheopportunitygap • CRF and ROA Guidancewww.communitiesscotland.gov.uk/Web/Site/Whatwedo/Communityregeneratinfund.asp