Download
1 / 50
500 likes | 680 Views
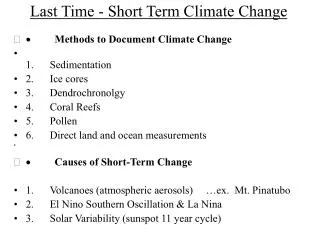
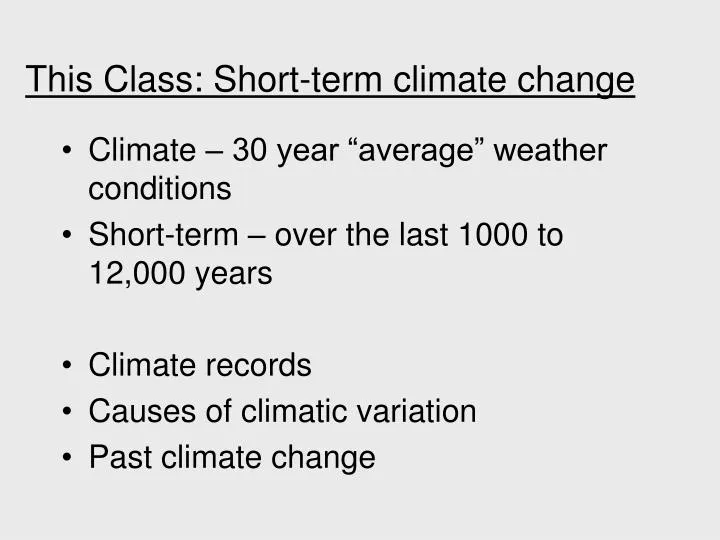
This Class: Short-term climate change. Climate – 30 year “average” weather conditions Short-term – over the last 1000 to 12,000 years Climate records Causes of climatic variation Past climate change. Records of climate. Records of climate. Historical (human) records instrumental

E N D
This Class: Short-term climate change • Climate – 30 year “average” weather conditions • Short-term – over the last 1000 to 12,000 years • Climate records • Causes of climatic variation • Past climate change
Records of climate • Historical (human) records • instrumental • written observations • maritime records • paintings • 12,000 paintings • 1400-1967
Records of climate, cont. • Phenological observations • agricultural records • price of rye in Germany • bird migrations
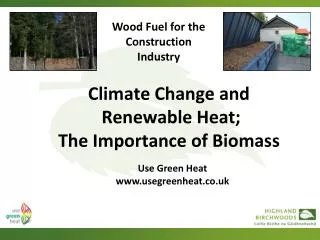
Dendrochronology • dating of past events through study of tree ring growth • thickness of the tree ring indicates growing season conditions • precipitation
building a chronology • overlapping rings from different trees • Bristlecone pine chronology is 9000 years long • long lives - 4,767 years old
Lake and ocean sediments • Sediments record environmental conditions present when they were deposited
Clues in the sediments • pollen - vegetation type • skeletons of small organisms - water chemistry, temperature • type of organisms - windiness • chemistry of sediments or organisms – temperature, precipitation
Elk Lake, Minnesota • http://geology.cr.usgs.gov/pub/fact-sheets/fs-0059-99/
Signals in Elk Lake sediments • diatoms - heavy, need wind to keep afloat = windy • quartz - blown into the lake = windy • sodium – retained in soils, not washed away = dry • pollen - vegetation type • 8,500 to 4000 years ago it was drier, prairie vegetation
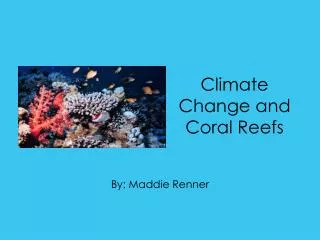
Coral reefs • growth bands • chemistry records sea temperature (oxygen isotopes)
Coral core and X-ray with growth bands slide/ coral core and x-ray
Calibration curve slide/ calibration curve of 18O and SST in coral oxygen isotope temperature (oC)
-5.3 -4.9 -4.5 -4.1 -3.7 1840 1860 1880 1900 1920 1940 1960 1980 2000 two prolonged La Niña events Oxygen isotope index Period of instrumental data
Ice cores • volcanic eruptions - ashes • atmospheric gasses - small air bubbles • temperature - oxygen isotopes • windiness - dust
Greenhouse gasses in ice cores • http://www.pages.unibe.ch/products/overheads2/icecores.html
Some causes of climatic variation • Ocean circulation • Sunspots • Volcanic eruptions • Atmospheric conditions • El Nino Southern Oscillation
Currents and climate • Miller 2.167
Sunspots • Dark spots (cool areas) that move across the surface of the sun* • Every 11 years there is a period called a “solar maximum” with lots of sunspots and solar flares • Today’s sunspot number http://www.sunspotcycle.com/ *But these dark areas are surrounded by hotter rings that more than make up for the difference in radiation
Fewer sunspots seem to be associated with: • lower temperatures • more severe winters • glacial advances
Volcanoes • blast gasses (sulfur dioxide) and ash into the lower stratosphere. • strong winds in stratosphere blow material around the world. • sulfur dioxide combines with water to for sulfuric acid aerosols (fine droplets) How does this affect climate?
Volcanoes, cont. • scatters incoming radiation back to space • reduces heating of earth’s surface • last up to four years
Pinatubo sulfur dioxide cloud June 17, 1991 June 19, 1991
Pinatubo stratospheric aerosols 40 days before 40 days after 20 months after
Average temperatures dropped by 0.2 to 0.5 oC for 1 to 3 years
El Niño – Southern Oscillation (ENSO) • Oscillation of southern high and low pressure zones • Weakening of Peruvian high pressure zone • Weakening of Indonesian low pressure zone • Weakening of southeast trade winds • Affects local climate
Upwelling off South America • 9.12a 2.209
El Niño year • 9.12b 2.207
ENSO teleconnections – affects on global climate Segar, 1998
Past periods of climate change • Medieval Warm Period • Little Ice Age Insert temperature recoreds
The Medieval Warm Period • 1000 to 1300 AD • regional warming (not necessarily global) • Longer and warmer growing season • grapes in England • Higher treelines • Warmer sea surface temperatures in North Atlantic • approx. 1o C warmer than present
The Little Ice Age • Very cold climate between 1560 and 1890 • Greater frequency of storms • Glacial advances 1560-1610,1816-1890
Wheat prices higher in Europe • Paintings darker, cloudier
Iceland Iceland population • Population declines in Iceland indicated by tax records • shift from grains to barley (short growing season) to no grains • fishing failed as fish migrated southward due to water temperatures. • Height declines • from 5’8” in 900s to 5’6” in 1700s in Iceland barley no grain
Greenland • 1300 highest population (3000) • Poor harvests, fewer livestock • Increase in sea ice decreased trade • Settlements abandoned • Height decrease from 5’7” to < 5’ by 1400
Based on temperature, precipitation, and tree ring records • http://www.ngdc.noaa.gov/paleo/drought/drght_pdsi.html • http://www.ngdc.noaa.gov/paleo/pdsiyear.html Locations of tree rings • http://www.ngdc.noaa.gov/paleo/pdsiyear.html
Little ice age • glacial advances
http://www.ucar.edu/learn/1_2_1.htm • for pollen, tree ring w/ fire scar
slide/ drilling coral Drilling a massive coral
http://www2.sunysuffolk.edu/mandias/lia/little_ice_age.html Many pictures of paintings, wheat prices, etc.