Download
1 / 13
130 likes | 264 Views
Myths and Realities of Urban Constraint in the UK:Changing Circumstances and Unchanged Realities. Alan Evans. Governments and U-turns. Governments Don’t Like Changing Policies Instead the reasons for the policy change. An Historical Example.

E N D
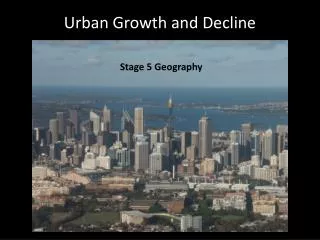
Myths and Realities of Urban Constraint in the UK:Changing Circumstances and Unchanged Realities Alan Evans
Governments and U-turns • Governments Don’t Like Changing Policies • Instead the reasons for the policy change
An Historical Example • 1950/60s – Concern over congestion in central London. • !964 - Labour government introduces Office Developments to control office development in London • 1967 Academic postgrad (AE) finds that that employment had peaked in 1962/63.
Result • Policy was now about encouraging movement of offices to the regions. • (1969) Two Cambridge researchers point out that offices won’t move that far. • Then about discouraging office building! • Then 1978 – Labour introduced ODPs so a Labour government can’t abolish them.
1979 • Thatcher elected May 5th. • ODPs abolished May 10th.
The Policy of Constraint • Introduced 1945/47 to protect and preserve agricultural land. • Also agricultural support from government, both before 1973 and afterwards through the CAP to maintain and increase production.
Productivity • Farmers increased production – • Yields doubled between 1940s and 1970s • Increased a further 50% by the 2000s. • But this altered the countryside. • And created unacceptable surpluses.
Changes in Agricultural Policy • Late nineties – ‘set aside’ • By 2005 10% of farmland in the South East was ‘set aside’. • In 2005 switch to the ‘single payment’. • Owners of farmland now receive a payment unrelated to production (in the UK £230 per hectare).
Any change in planning constraint? • Yes, it has become stricter. • But the Rogers Report 1999 doesn’t mention agriculture. • The constraint is needed to protect the ‘wild life, tranquillity, and beauty of the countryside’.
The Policy hasn’t changed but the reasons for the policy have! But the cost is higher house and land prices and the smallest new homes in western Europe. And less and less open land within cities! But older home owners like rising house prices (and the young live in the new small homes.)
Why is this accepted? • People believe myths about the countryside and only visit a few beauty spots (which are then very crowded.) • Walking, as I do, in the country, I see this, but… • Interest groups propagate myths.
Near London by far the greatest use of agricultural land that one sees is now for grazing the horses of the wealthy. • And large areas of land have been converted to golf courses.
Conclusion • Like ODPs in the seventies the policy continues because it exists. • But at some point it will have to change. • The UK cannot continue with a policy which leads to house prices doubling in real terms every twenty five years.