Download

1 / 21
210 likes | 461 Views
DAT340 SQL Server Performance Series – Part 1 – Introduction to Performance Tuning. Maciej Pilecki Consultant, SQL Server MVP Project Botticelli Ltd. maciej.pilecki@projectbotticelli.com. About me. Microsoft Certified Trainer since 2001 SQL Server MVP since Jan 2006

E N D
DAT340SQL Server Performance Series – Part 1 – Introduction to Performance Tuning Maciej Pilecki Consultant, SQL Server MVP Project Botticelli Ltd. maciej.pilecki@projectbotticelli.com
About me • Microsoft Certified Trainer since 2001 • SQL Server MVP since Jan 2006 • Specializing in SQL Server database development and administration • Delivering training and consulting services around the world • Frequent speaker at many international conferences and UG meetings • „Dr. House of SQL”
Structure of this session • 3 part session: • DAT340 - SQL Server Performance Series – Part 1 – Introduction to Performance Tuning – this session • DAT341 - SQL Server Performance Series - Part 2 - Server and Database Tuning – Thurdsay, 16:30 – 17:30, Room Paris 1 • DAT342 - SQL Server Performance Series – Part 3 – Query and Index Tuning – Friday, 10:30 – 11:30, Room Paris 2 • Follow-up: Meet me at TLC with your questions on Friday from 12:00 – 14:00 – SQL Server Mission Critical stand • Or email me at maciej@projectbotticelli.com
Agenda for today • What is a performance issue? • How do you know if you have one? • The process… • The tools… • The tricks…
What is a performance issue? • The definition depends on who you are talking to… • Here is mine: Performance issue is a situation where sub-optimal queries and/or sub-optimal configuration and/or sub-optimal application/database design lead to resource over-utilization and/or increased query response times. • But it’s not about making one query run fast – we want consistent database performance over time!
How do you know if you have one? • You notice it – the good. • Users call to complain about slowness – the bad. • You don’t know – the ugly. • What’s your SLA? • Do you have one? • They always ask for sub-second response time, but…
Some interesting rules • You don’t fix a performance problem by throwing more hardware at it – that rarely helps in the long run. • Murphy’s Law is universal – applies to databases as well. • Pareto principle – 80/20 • Heisenberg’s Uncertainty Principle – the closer we look, the less we see • Brady’s Principle – the context is practically everything when it comes to determining meaning
Getting there… • It’s an iterative process: • Establish baseline • Define the problem • Fix one thing at a time • Test and re-establish baseline • Rinse and repeat • It never ends: • There will always be Top 10 • As soon as one bottleneck is removed, another pops up. • There is always some bottleneck!
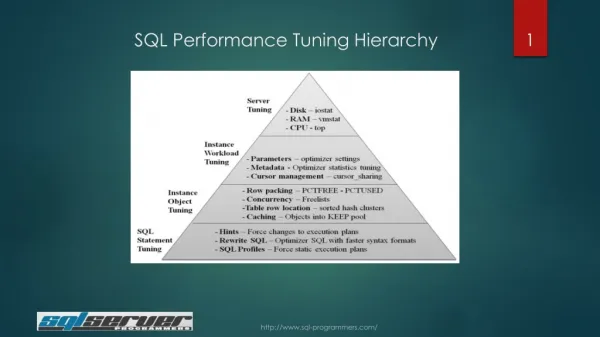
What do you need? • Know the data and the app (and the developers). • Know your server and its capacity. • Know your tools: • Performance Monitor – PerfMon • SQL Server Profiler • Dynamic Management Views – DMVs • SQL Server Management Studio – SSMS • Database Tuning Advisor – DTA • …and Excel
Establishing baseline • 24 hours in the life of your system… • Run a 24h Profiler trace • Everything you need is in SQL:BatchCompleted and RPC:Completed • Filter by application, user, database as needed • Trace to a file, server-side • When done, load into a table and aggregate – SUM(Reads, Writes, Duration, CPU, Execution count) • Capture 24 hours of PerfMon counters • CPU %, Batches/sec, Active Connections, Database I/O, etc. • And graph in Excel!
Be good doctor… • …and ask your SQL Server where it hurts! • It WILL tell you: • sys.dm_os_wait_stats • sys.dm_exec_query_stats • sys.dm_db_index_operational_stats
sys.dm_os_wait_stats • Response time = execution time + wait time • DMV shows aggregated wait stats on server level • What’s your top wait state? • Smoking gun for bottleneck on your system • Gets really interesting when you start sampling them in 5-10 minute intervals – calculate delta, graph in Excel • On SQL 2000 use DBCC SQLPERF(waitstats)
How to interpret waitstats? • Parallelism: CXPACKET • CPU pressure: SOS_SCHEDULER_YIELD • Network I/O: ASYNC_NETWORK_IO • Long term blocking: LCK_X, LCK_M_U, & LCK_M_X • Buffer I/O latch: PAGEIOLATCH_X • Buffer latch: PAGELATCH_X • Non-buffer latch: LATCH_X • Memory grants: RESOURCE_SEMAPHORE • Tran log disk subsystem: WRITELOG & LOGBUFFER • General I/O issues: ASYNC_IO_COMPLETION & IO_COMPLETION • Look up in BOL
Harmless waits • Some waits represent idle waits and are normal. • A few examples: • LAZYWRITER_SLEEP • CHECKPOINT_QUEUE • RESOURCE_QUEUE • WAITFOR • REQUEST_FOR_DEADLOCK_SEARCH • CLR_AUTO_EVENT and CLR_MANUAL_EVENT • See Glenn Berry’s blog post titled „A Small Collection of I/O Specific DMV Queries”
Finding the „BIG” queries • Use your 24h trace data, or… • sys.dm_exec_query_stats • Execution stats for every cached execution plan • If it’s not in cache, it’s not in stats! • Look for top queries by reads, writes, CPU, execution count • SQL Server 2008 adds query_hash and query_plan_hash • Use sys.dm_exec_sql_text for query text • Use sys.dm_exec_query_plan for XML query plan
Looking for contention • sys.dm_db_index_operational_stats • Shows lock and latch contention on individual indexes • Can be used to diagnose blocking
Summary • What is a performance issue? • How do you know if you have one? • The process… • The tools… • The tricks…
What’s next • DAT341 - SQL Server Performance Series - Part 2 - Server and Database Tuning – Thurdsay, 16:30 – 17:30, Room Paris 1 • DAT342 - SQL Server Performance Series – Part 3 – Query and Index Tuning – Friday, 10:30 – 11:30, Room Paris 2 • Follow-up: Meet me at TLC with your questions on Friday from 12:00 – 14:00 – SQL Server Mission Critical stand • Or email me at maciej@projectbotticelli.com
Session Evaluations Tell us what you think, and you could win! All evaluations submitted are automatically entered into a daily prize draw* Sign-in to the Schedule Builder at http://europe.msteched.com/topic/list/ * Details of prize draw rules can be obtained from the Information Desk.
© 2010 Microsoft Corporation. All rights reserved. Microsoft, Windows, Windows Vista and other product names are or may be registered trademarks and/or trademarks in the U.S. and/or other countries. The information herein is for informational purposes only and represents the current view of Microsoft Corporation as of the date of this presentation. Because Microsoft must respond to changing market conditions, it should not be interpreted to be a commitment on the part of Microsoft, and Microsoft cannot guarantee the accuracy of any information provided after the date of this presentation. MICROSOFT MAKES NO WARRANTIES, EXPRESS, IMPLIED OR STATUTORY, AS TO THE INFORMATION IN THIS PRESENTATION.