Download
1 / 12
150 likes | 414 Views
Upper Air Charts. By Tom Collow November 8, 2010. Reading Upper Air Charts. Wind direction and speed (knots). Temperature ( °C). Height. Dewpoint Depression ( °C).

E N D
Upper Air Charts By Tom Collow November 8, 2010
Reading Upper Air Charts Wind direction and speed (knots) Temperature (°C) Height Dewpoint Depression (°C) Temperature, dewpoint depression, wind speed, and wind direction are read the same on the charts for every level. The circle is filled in for a dewpoint depression less than 5°C. However, there are different procedures for reading the height value depending on what level chart you are looking at. The methods shown are those followed by the National Weather Service. Some agencies use different formats so be sure to check to see if you are using the correct procedure.
Types of Contours • Isobar – line of constant pressure (These do not exist on a constant pressure chart) • Isoheight/Isohyspe = line of constant height on a constant pressure chart • Isotherm = line of constant temperature • Isotach = line of constant wind speed
850 mb • To find the actual height place a “1” in front of the three digit number on the plot. • Ex. If the plot has 532, then the height is 1532 m. • The 850 mb temperature is often used as a guide in precipitation type during winter storms. • 850 mb. Temperature > 0°C = Rain • 850 mb. Temperature < 0°C = Snow • The pattern of troughs and ridges is not well defined at this level. • 850 mb data does not exist for parts of the western United States. Why? • Some locations in the Rocky Mountains have an elevation above that of the 850 mb level.
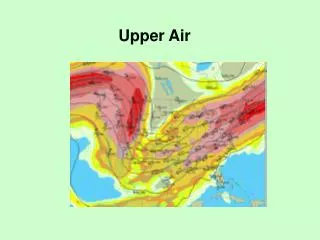
Sample 850 mb Map from 12 UTC 0°C Isotherm Low Pressure System 0°C Isotherm High Pressure System
700 mb • To find the actual height place a “2” or “3” in front of the three digit number on the plot. • Add “2” if number is between 500 and 999 • Add “3” If number is between 000 and 499 • Or another way is to add whichever number brings the actual height closer to 3000 m. • Ex. If the plot has 148, then the height is 3148 m. • Ex. If the plot has 894, then the height is 2894 m. • Troughs and ridges begin to become better defined. • Dewpoint depressions at this level, as well as at the 850 mb level, give meteorologists an idea of the depth of the moisture layer. This is important for precipitation and severe weather forecasting.
Sample 700 mb Map from 12 UTC Ridge Low dewpoint depressions Trough High dewpoint depressions
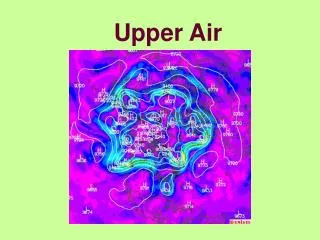
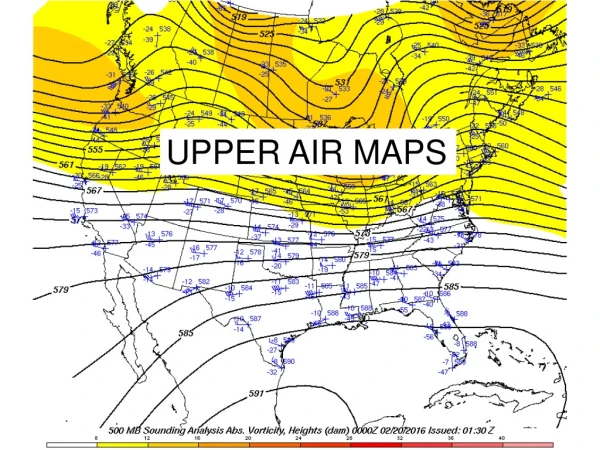
500 mb • To find the actual height, add a “0” to the end of the three digit number on the chart • Troughs and ridges are well defined at 500 mb • The 500 mb height is the height at which half the mass of the atmosphere is below and half the mass is above • The 500 mb height gives a good estimate of the mean atmospheric flow • Vorticity is another important variable measured at 500 mb. Vorticity is the measure of the rotation of air horizontally. • Positive vorticity leads to upward vertical motion which leads to precipitation and clouds
Sample 500 mb map from 12 UTC today Shortwave Trough Ridge Closed low Regions of positive vorticity are shaded
300 mb and 200 mb • To find the height on a 300 mb map, follow the same procedure as on a 500 mb map • For a 200 mb map, add a “1” to the front of the three digit number and a “0” at the end • Ex. A chart value of 220 means a height of 12200 m. • Jet streams are found at these levels • The jet streak is a region of maximum winds within a jet stream. • The jet stream is usually a divider of temperature. It is warmer to the south of the jet stream and colder to the north
Sample 300 mb map from 12 UTC today Jet Streak Jet Streak Wind speeds are shaded
Sample 200 mb map from 12 UTC today Jet Streak Low still closed at 200 mb Jet Streak Wind speeds are shaded