Download
1 / 40
400 likes | 466 Views
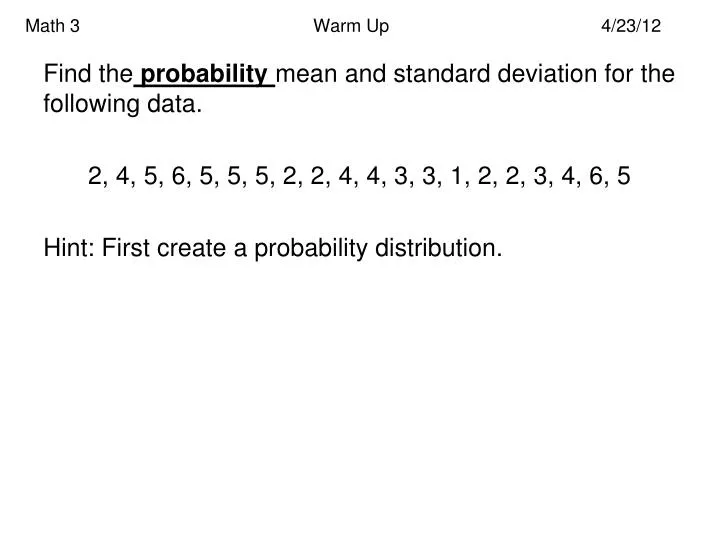
Math 3 Warm Up 4/23/12. Find the probability mean and standard deviation for the following data. 2, 4, 5, 6, 5, 5, 5, 2, 2, 4, 4, 3, 3, 1, 2, 2, 3, 4, 6, 5 Hint: First create a probability distribution. Unit 6: Data Analysis . Empirical Rule.

E N D
Math 3 Warm Up 4/23/12 Find the probability mean and standard deviation for the following data. 2, 4, 5, 6, 5, 5, 5, 2, 2, 4, 4, 3, 3, 1, 2, 2, 3, 4, 6, 5 Hint: First create a probability distribution.
Unit 6: Data Analysis Empirical Rule
What does a population that is normally distributed look like?
Empirical Rule 68% 95% 99.7% 68-95-99.7% RULE
Empirical Rule 68% 95% 99.7% 68-95-99.7% RULE
Empirical Rule 68% 95% 99.7% 68-95-99.7% RULE
Empirical Rule 68% 95% 99.7% 68-95-99.7% RULE
EmpiricalRule—restated 68% of the data values fall within 1standard deviation of the mean in either direction 95% of the data values fall within 2standard deviation of the mean in either direction 99.7% of the data values fall within 3standard deviation of the mean in either direction Remember values in a data set must appear to be a normal bell-shaped histogram, dotplot, or stemplot to use the Empirical Rule!
Empirical Rule 34% 34% 68% 47.5% 47.5% 95% 49.85% 49.85% 99.7%
Average American adult male height is 69 inches (5’ 9”) tall with a standard deviation of 2.5 inches.What does the normal distribution for this data look like?
Empirical Rule-- Let H~N(69, 2.5) What is the likelihood that a randomly selected adult male would have a height less than 69 inches? Answer: P(h < 69) = .50 P represents Probability h represents one adult male height
Using the Empirical Rule Let H~N(69, 2.5) What is the likelihood that a randomly selected adult male will have a height between 64 and 74 inches? P(64 < h < 74) = .95 In Calculator: 2nd Vars: normalcdf(lower, upper, mean, std. dev.)
Using the Empirical Rule Let H~N(69, 2.5) What is the likelihood that a randomly selected adult male will have a height between 64 and 74 inches? In Calculator: 2nd Vars normalcdf(lower, upper, mean, std. dev.) For this example: 2nd Vars Normalcdf(64, 74, 69, 2.5) = .95
Using Empirical Rule-- Let H~N(69, 2.5) What is the likelihood that a randomly selected adult male would have a height of less than 66.5 inches? = .16
Using Empirical Rule--Let H~N(69, 2.5) What is the likelihood that a randomly selected adult male would have a height of greater than 74 inches? = .025
Using Empirical Rule--Let H~N(69, 2.5) What is the probability that a randomly selected adult male would have a height between 64 and 76.5 inches? = .9735
Math 3 Homework Extended Question April 25,2012 A set of 1000 values has a normal distribution. The mean data is 120, and the standard deviation is 20. • Create the normal distribution for this data. • Get out homework and have questions ready.
Unit 6: Data Analysis Z-Score
Z-Scores are standardized standard deviation measurements of how far from the center (mean) a data value falls. Ex: A man who stands 71.5 inches tall is 1standardized standard deviation from the mean. Ex: A man who stands 64 inches tall is -2standardized standard deviations from the mean.
Standardized Z-Score To get a Z-score, you need to have 3 things • Observed actual data value of random variable x • Population mean, also known as expected outcome/value/center • Population standard deviation, Then follow the formula.
Empirical Rule & Z-Score About 68% of data values in a normally distributed data set have z-scores between –1 and 1; approximately 95% of the values have z-scores between –2 and 2; and about 99.7% of the values have z-scores between –3 and 3.
Z-Score &Let H ~ N(69, 2.5) What would be the standardized score for an adult male who stood 71.5 inches? H ~ N(69, 2.5) Z ~ N(0, 1)
Z-Score &Let H ~ N(69, 2.5) What would be the standardized score for an adult male who stood 65.25 inches? h = 65.25 as z = -1.5
Comparing Z-Scores Suppose Bubba’s score on exam A was 65, where Exam A ~ N(50, 10). And, Bubbette score was an 88 on exam B, where Exam B ~ N(74, 12). Who outscored who? Use Z-score to compare. Bubba z = (65-50)/10 = 1.500 Bubbette z = (88-74)/12 = 1.167
Comparing Z-Scores Heights for traditional college-age students in the US have means and standard deviations of approximately 70 inches and 3 inches for males and 165.1 cm and 6.35 cm for females. If a male college student were 68 inches tall and a female college student was 160 cm tall, who is relatively shorter in their respected gender groups? Male z = (68 – 70)/3 = -.667 Female z = (160 – 165.1)/6.35 = -.803
Reading a Z Table P(z < -1.91) = P(z -1.74) =
Reading a Z Table P(z 1.63) = P(z < 1.81) =
Find P(z < 1.85) From Table: .9678 -3 -2 -1 0 +1 +2 +3 1.85
Using TI-83+ 2nd: 2nd Vars DRAW 1: ShadeNorm( 1st: WINDOW 3rd: ShadeNorm(lower, upper, mean, std. dev) 4th: 2nd PRGM 1: ClrDraw
Find P(z > 1.85) From Table: .9678 -3 -2 -1 0 +1 +2 +3 1.85
Find P( -.79 < z < 1.85) -1 +1 +2 -3 -2 0 +3 -.79 1.85
What if I know the probability that an event will happen, how do I find the corresponding z-score? • Use the Z Tables and work backwards. Find the probability value in the table and trace back to find the corresponding z-score. • 2) Use the InvNorm command on your TI by entering in the probability value (representing the area shaded to the left of the desired z-score), then 0 (for population mean), and 1 (for population standard deviation).
P(Z < z*) = .8289What is the value of z*? P(Z < z*) = .8289 has the value of z* = .95 Therefore, P(Z < .95) = .8289.
P(Z < z*) = .80What is the value of z*? P(Z < .84) = .7995 and P(Z < .85) = .8023, therefore P(Z < z*) = .80 has the value of z* approximately .84??
P(Z < z*) = .77What is the value of z*? What is the approximate value of z*?