Download
1 / 20
300 likes | 783 Views
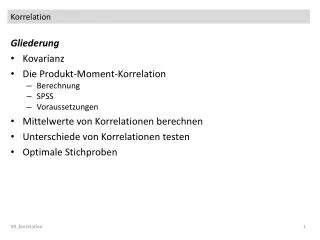
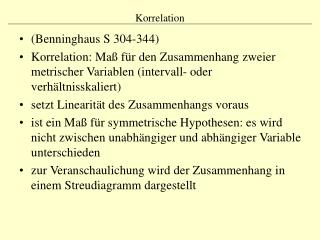
Korrelation. Forschungsmethodik II, SS 2010 Vesna Pavlovski & Julia Pichlhöfer. Wozu dient dieses Verfahren?. Prüfen von Zusammenhangshypothesen Analyse der Beziehungen von Variablen Vorhersage ? ? ?. Karl Pearson. Wertebereich der Korrelation von -1 bis +1.

E N D
Korrelation Forschungsmethodik II, SS 2010 Vesna Pavlovski & Julia Pichlhöfer
Wozu dient dieses Verfahren? • Prüfen von Zusammenhangshypothesen • Analyse der Beziehungen von Variablen • Vorhersage ? ? ?
Wertebereich der Korrelation von -1 bis +1 r = Maß für den linearen Zusammenhang = Korrelationskoeffizient 1. Richtung des Zusammenhangs (Vorzeichen) 2. Höhe des Zusammenhangs (Absolutbetrag) r = +1 perfekte positive Korrelation r = - 1 perfekte negative Korrelation r = 0 kein Zusammenhang
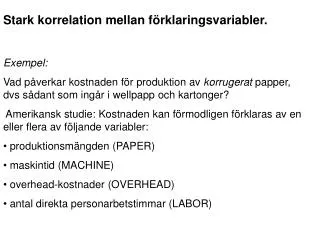
Beispiel zum Pearson´s - Korrelationskoeffizienten Variablen: intervallskaliert und normalverteilt 7 Mitarbeitern einer Firma wurde ein Fragebogen zur Arbeitszufriedenheit vorgegeben. (hohe Werte, hohe Zufriedenheit) Die Anzahl der Tage im Krankenstand pro Monat wurde miterhoben. Wertetabelle:
Statistisches Vorgehen • Kovarianz berechnen • Korrelation berechnen • Die Nullhypothese prüfen (H0: p=0)
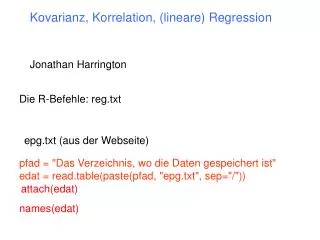
Kovarianz • ist die Grundlage der Korrelation • ist der Mittelwert der Produkte der korrespondierenden Abweichungswerte (x, y) einer Person. („Varianz“)
Berechnung der Mittelwerte: Berechnung der Kovarianz:
Prüfen der Nullhypothese H0: Es besteht kein Zusammenhang H1: Es besteht ein Zusammenhang Voraussetzungen: 1. n ≥ 4 2. bivariate Normalverteilung • p < .05 • H0 wird verworfen, es besteht ein Zusammenhang
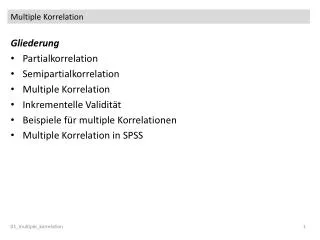
Partialkorrelation Ein Beispiel: n = 100 Blutdruck x Reaktionsgeschwindigkeit: +.31 Blutdruck x Alter: +.64 Alter x Reaktionsgeschwindigkeit: +.47
Signifikanzprüfung • ns! • Die partielle Korrelation (unter Ausschluss des Alters r = .02; ns.) legt nahe, dass der Zusammenhang auf den Einfluss des Alters zurückzuführen ist.
Rangkorrelation • Nach Spearman: Signifikanzprüfung mittels t - Prüfgröße • Nach Kendall: Signifikanzprüfung mittels standardnormalverteilte Prüfgröße (z) … S ist die „ Kendall – Summe“ und ergibt sich aus ∑P - ∑ I .
Punktbiserale Korrelation 1 dichotome Variable 1 intervallskalierte, normalverteilte Variable Beispiel: Geschlecht und Körpergröße Formel und Signifikanzprüfung (Handout)
Vierfelderkorrelation / Phi - Korrelation 2 dichotome Variablen: Geschlecht und Depressionen von Patienten r = - 0,166 = 8,101 p < .01
Vielen Dank für eure Aufmerksamkeit!