Download
1 / 41
410 likes | 468 Views
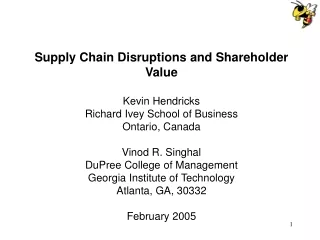
Demand-Supply Mismatches and Shareholder Value: The Case of Excess Inventories Kevin Hendricks Wilfried Laurier University Waterloo, Canada Vinod R. Singhal College of Management Georgia Institute of Technology Atlanta, GA, 30332 November 19, 2010. Some thoughts.

E N D
Demand-Supply Mismatches and Shareholder Value: The Case of Excess Inventories Kevin Hendricks Wilfried Laurier University Waterloo, Canada Vinod R. Singhal College of Management Georgia Institute of Technology Atlanta, GA, 30332 November 19, 2010
Some thoughts • Without facts you are just another person with an opinion • unless • you are at a level of the organization where your opinion becomes fact • When research is limited or absent, anecdotes prevail
Supply chain performance and shareholder value • Shareholder Value = Create - Destroy • Poor supply chain performance destroys shareholder value • Demand-supply mismatches are examples of poor supply chain performance • Practices that prevent demand-supply mismatches create value by avoiding value destruction
Issues examined • Effect of demand/supply mismatches on shareholder value • Supply is less than demand (undersupply) • Supply is greater than demand (oversupply) • Delays in introduction of new products • Focus on excess inventory - supply greater than demand
Issues examined • Shareholder value effects of excess inventory? • How do the shareholder value effects of excess inventory vary by firm characteristics? • - Location of excess inventory (firm or customers) • - Size • - Growth prospects • - Debt-equity ratio • Stock price volatility effects of excess inventory? • Operating performance effects of excess inventory?
Plan • Review of some recent empirical work on inventory • Consequences of excess inventory • Sample • Measurement time period • Methods to estimate the shareholder value effects • Statistical tests • Results • Implications
Recent empirical work • Overall trend in inventory behavior • - Rajagopalan and Malhotra (2001), Chen et al. (2005) • Drivers of inventory turnover/levels • - Rouminatsev and Netessine (2005), Gaur et al. (2005), Lai (2005) • JIT implementation/inventory reduction and financial performance • - Huson and Nanda (1995), Balakrishnan et al. (1996), Lieberman and Demister (1999) • Inventory turnover and corporate performance • - Chen at al. (2005), Kesavan et al. (2010) • Inventory write offs • - Francis et al. (1996), Lai (2005)
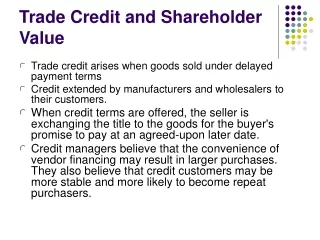
Consequences of excess inventories • Higher inventory holding costs • Drop in component prices • Price protection • Product returns • Cost of curtailing production/temporary shutting of facilities • Write-offs and associated disposal costs • Limited pricing power • Hamper ability to introduce new and innovative products • Management credibility • Shareholder lawsuits
Sample (inventory or inventories) near5 (obsolete or obsolescence or excess or excessive or glut or buildup or builds or build or building or reduce or reducing or reduced or reduces or reduction or reductions or bloated or bloating or charge or charges or charging or write$ or adjust or adjustment or adjustments or adjusts or adjusting or adjusted or liquidate or liquidates or liquidating or liquidated or loss$ or accumulate or accumulates or accumulated or accumulating or revaluate or revaluates or revaluated or revaluating or revaluation)
Sample • 276 announcements of excess inventory situations from Wall Street Journal and Dow Jones News during 1990-2002 • Jabil circuits announces that customers are reducing inventories, Dow Jones News Service March 18, 1998 • Champion International plans to curtail production to reduce its office-paper inventory”, The Wall Street Journal, August 4, 1998. • Eastman Kodak cutting prices 15% to 20% to liquidate inventory, Wall Street Journal, September 30, 1997. • Intel to write down inventories of components, Dow Jones News Service March 16, 1996 • Announcements dates provide a reference point for measuring performance
Distribution of sample firms by equity value Sample includes firms from 91 three-digit SIC codes
Distribution of sample announcements Recessions – July 1990 to March 1991 and March 2001 to November 2001 (42 announcements – 15% of the announcements)
Methodology • Stock market’s reaction to excess inventory announcements • Stock market’s reaction is normally referred to as Abnormal Return • Estimate abnormal returns around the time of announcement • Abnormal returns associated with excess inventory announcement • = actual return including the effect of excess inventory - expected return (normal return) without the excess inventory • Test for statistical significance
Day before the announcement Announcement date -210 -10 0 -1 Estimation Period Method for computing expected returns • On March 18, 1998 Jabil Circuits announces excess inventory • Set March 18, 1998 as day 0 in event time • Day -1 is the previous trading day • Day 1 is the following trading date • Estimation period models • - Market Model: Ri = ai + Bi Rm • - Mean Adjusted Model: Ri = average return during the estimation period • - Mean Adjusted Model: Ri = average market return during the estimation period • Abnormal return = actual return – expected return
Testing statistical significance of abnormal returns • Mean abnormal returns • Standard t-tests • Median abnormal return • - Wilcoxon sign-rank test • % of abnormal returns that are negative • - Binomial sign test
Abnormal returns on excess inventory announcements % of sample firms with abnormal negative returns
Sample versus Industry • Are sample firms poor performers? • Variable Sample Industry • Return on assets 14.37% 11.51% • Return on sales 12.97% 9.36%** • Sales over assets 106.55% 120.10% • Inventory turnover 3.92 4.04 • Sample firms are not doing worse than the industry before the excess inventory announcement.
Market Overreaction • Examine the abnormal stock price performance over six months after announcement. • 120 day buy-and-hold abnormal returns • PortfolioMeanMedian% Negative • Market adjusted -1.01% -5.00% 55.15% • Industry adjusted 1.11% -2.34% 53.71% • Size adjusted -0.71% -4.23% 56.25% • No evidence of post-announcement abnormal performance
Comparison with stock market reaction to other corporate events Operational events Increase in capital expenditure 1.0% Increase in R&D expenditure 1.4% Effective TQM implementation 0.7% Internal corporate restructuring 1.0% Decrease in capital expenditure -1.8% Plant closing -0.7% Automotive recalls (US) -0.4% Automotive recalls (Japanese) -0.6% Marketing events Change in firm name 0.7% Brand leveraging 0.3% Celebrity endorsement 0.2% New product introduction 0.7% Affirmative action awards 1.6% Information technology events IT Investments 1.0% IT problems -1.7% Financial events Stock splits 3.3% Open market share repurchase 3.5% Proxy contest 4.2% Increasing financial leverage 7.6% Decreasing financial leverage -5.4% Seasoned equity offerings -3.0%
Abnormal returns from different types of demand-supply mismatches
Explaining abnormal returns – regression analyses Variable Predicted Sign Estimated Coeff. Excess inventory at Negative -0.025 (p ≤ 0.05) Customer Growth prospects (Book to market ratio) positive 0.054 (p ≤ 0.01) Size (Natural log of sales) positive 0.017 (p ≤ 0.01) Debt Ratio positive -0.082(p ≤ 0.025)
Stability tests – regressions with controls • Industry controls • Industry inventory turnover • Industry sales growth • Industry competitiveness • Firm level control variables • - Inventory turnover • - Sales growth • Time period – recessionary or non-recessionary • - reaction is less negative in recessionary period
Volatility - Measurement time period • On March 18, 1998 Jabil Circuits announces excess inventory • Set March 18, 1998 as day 0 in event time Base year Announcement date Year -1 Year -2 Year 1 Year 2 262 -514 -262 -11 0 11 514
Volatility changes On average 12% increase in volatility
Estimating profitability impacts • Return on assets • Operating income normalized by total assets • Sales over assets • Return on Sales • Operating income normalized by sales
Base year Announcement Year Year -2 Year -1 Year 0 Year 1 Methodology – setting the time period
Summary • Excess inventory causes significant destruction in corporate performance • It does not matter where is the buildup of excess inventory – it still hurts • Excess inventories at customers are penalized more by the market • The effect of excess inventory is more negative for smaller firms and firms with high growth prospects • The effect of excess inventory is negative irrespective of industry, calendar time, and actions taken
Future research • Understand how upstream and downstream supply chain partners get affected by supply/demand mismatches • Demand/supply mismatches and cost of capital