Download
1 / 29
290 likes | 421 Views
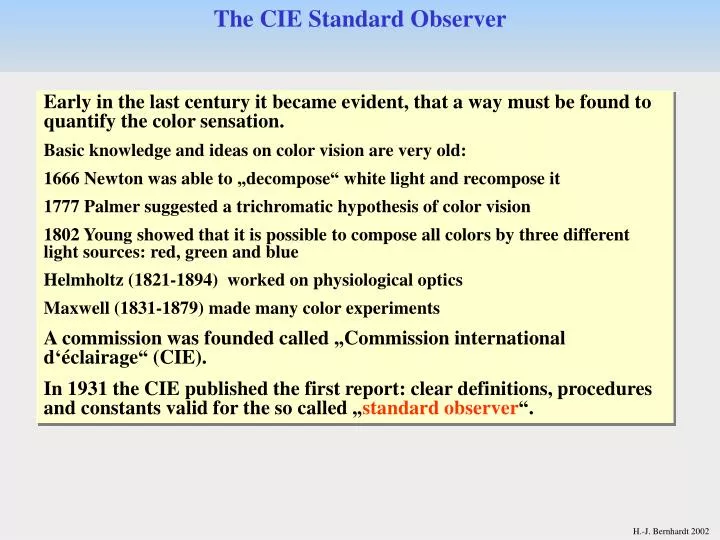
The CIE Standard Observer. Early in the last century it became evident, that a way must be found to quantify the color sensation . Basic knowledge and ideas on color vision are very old : 1666 Newton was able to „ decompose “ white light and recompose it

E N D
The CIE Standard Observer Early in the last centuryitbecame evident, that a way must befoundtoquantifythecolorsensation. Basic knowledgeandideas on colorvisionareveryold: 1666 Newton was ableto „decompose“ whitelightandrecomposeit 1777 Palmer suggested a trichromatichypothesisofcolorvision 1802 Young showedthatitispossibletocompose all colorsbythree different lightsources: red, greenandblue Helmholtz (1821-1894) worked on physiologicaloptics Maxwell (1831-1879) mademanycolorexperiments A commission was foundedcalled „Commission international d‘éclairage“ (CIE). In 1931 the CIE publishedthefirstreport: cleardefinitions, proceduresandconstants valid forthe so called „standardobserver“. H.-J. Bernhardt 2002
Calculation of Color Values Color Definition Definition of color Color is the sensation of the eye with which it possible to distinct two adjacent parts of a structurefree observation field (DIN 5033, CIE) White and black are colors in the sense of the definition. Color is not a property of matter. The same color can be evoked by various stimulation curves (so called Metamerism). Identical stimulation curves always result in identical colors. H.-J. Bernhardt 2002
The Human Eye 3 types of cones for color vision in retina Rodes for luminance H.-J. Bernhardt 2002
The Human Retina H.-J. Bernhardt 2002
Color Formation Radiation function S H.-J. Bernhardt 2002
Subtraktive und additive Farbmischung Subtraktive Farbmischung Additive Farbmischung Absorption durch einen oder mehrere Filter Projektion von farbigem Licht auf eine weiße Fläche H.-J. Bernhardt 2011
C = RR+GG+BB Does not work in the blue-green region 700 nm 546 nm 435 nm Therefore: C+RR=GG+BB C=-RR+GG+BB H.-J. Bernhardt 2002
Tristimulus Values for Real Primary Sources Usingthethreeprimarysourcesof 700nm, 546nm and 435 nmthetristimulusvaluesshow negative valuesforcolormatching in thegreenregion. H.-J. Bernhardt 2002
Color Point C in a Three Dimensional Rectangular Diagram (Rotated) B C = RR+GG+BB R,G,B: unit vectors C hits the unit plane of R,G,B in point C C G R H.-J. Bernhardt 2002
The Unit Plane in Tristimulus Color Space The vectorofcolor C intersectstheunit plane in point C. The coordinatesare r, g, b C B R + G + B G R + G + B R R + G + B r = g = b = r+g+b=1 therefore only two values are needed H.-J. Bernhardt 2002
Chromaticity Diagram for Real Primaries 700 nm, 546 nm, 435 nm H.-J. Bernhardt 2002
Transition From the Real Primary RGB Illumination to Imaginary X,Y,Z In order to avoid negative color values, the real primary illuminations R, G, B were exchanged with the virtual illuminations X,Y, Z. All needed constants were transformed mathematically. Result is the well known CIE chromaticity diagram H.-J. Bernhardt 2002
CIE Tristimulus Functions Tristimulus functions The numericalvaluesofthetristimulusfunctionsaretabulatedbythe CIE xyz H.-J. Bernhardt 2002
The CIE Color Chart Locus of spectral colors Purple line H.-J. Bernhardt 2002
The CIE Chromaticity Diagram H.-J. Bernhardt 2002
Relative Spectral Power Distribution for Illuminant A, C, SUN The numericalvaluesoftheradiationfunctionsaretabulatedbythe CIE H.-J. Bernhardt 2002
Illuminants A, C, D65 in the Chromaticity Diagram Black Body Radiator from 2500 to Infinite °Kelvin H.-J. Bernhardt 2002
Schematic Color Calculation – Body Colors, Self Radiators X=k*R()*S()*x()*d() Standard Illumination A, C, D65 S Y=k*R()*S()*y()*d() Z=k*R()*S()*z()*d() Body (opaque mineral) R S*R Z X Y z= x= y= X+Y+Z X+Y+Z X+Y+Z Brain Subjective color vision Eye 3 types of cones (x y z) * Color stimulation Self radiator (e.g. lamp) S = S Radiation function of a standard source Color stimulation function R Spectral reflectance x y z Tristimulus functions k Normalisation factor to Y = 1 H.-J. Bernhardt 2002
Determination of Helmholtz Values Color value of illumination Draw a linefrom P via thepointoftheilluminant ( hereitis C) tothelocusofspectralcolors. Therereadthe dominant wavelength (D). Calculatetherelation CP/CD . Itisthespectralpurityvaluegiven in %. Iftheline CP leadstothepurpleline, readthe dominant wavelengthatthespectralcolorlocusandindexthevalueby c (complementary) Color value of sample D Dominant wavelength D P C P Purple line H.-J. Bernhardt 2002
Color Calculation for Ore Minerals Step 1: definestepsizeofwavelengths Step 2: defineilluminant Step 3: normalizetristimulusvaluesto Y = 1 Step 4: multiply all reflectancevalues Rwiththe correspondingtristimulusx,y,zandilluminant values S Step 5: buildthethree sums X,Y,Z Step 6: computex,y,z, Y (istheluminance) Result: x,y,Y H.-J. Bernhardt 2002
Iso-Iluminance Lines Projected on the Chromaticity Diagram H.-J. Bernhardt 2002
The Three Dimensional Color Body Color Point of illuminant C In the color space and on the chromaticity diagram H.-J. Bernhardt 2002
The Munsell Color Diagram H.-J. Bernhardt 2002