Download
1 / 39
390 likes | 411 Views
This tutorial explains the concept of clustering in differential gene expression analysis and the methods used to identify genes with different expression patterns. It also covers the process of aligning reads to a reference genome and quantifying gene expression. Additionally, it discusses normalization techniques and statistical analysis for identifying differentially expressed genes.

E N D
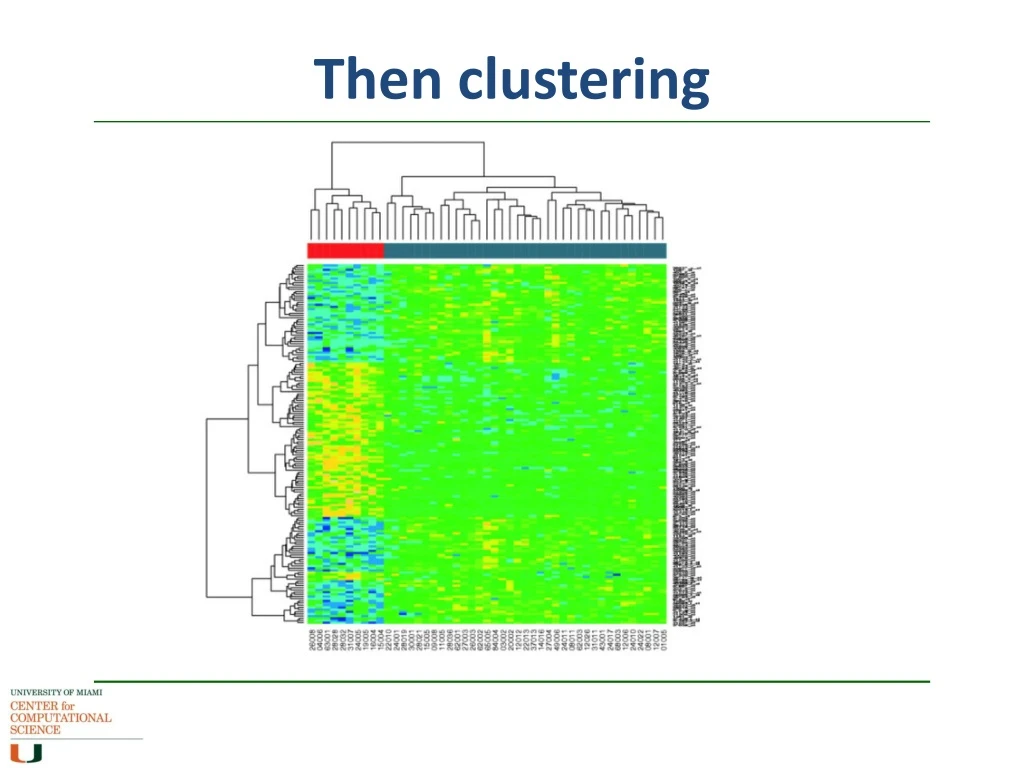
Then clustering In differential gene expression, you are looking for genes that behave differently between one sample and another, either up- or down- Once you get your DE gene set, you group the genes according to similar expression, and the outliers become more obvious Clustering methods similar to those of phylogenetics, but without the evolutionary weightings, ie distance matrices More downstream analysis later in the course
RNA-seq Same concept as sequencing ESTs and counting SAGE tags, but does not stop at short segments and tags. What is being sequenced is the cDNA from the mRNA component. Sequencing of whole transcriptome of a sample (NGS), and comparing it against the whole transcriptome of another sample. Costly, informative, bioinformatics not yet fully sorted out- when does a lot of data become too much data?
It’s all about the alignment First, you align your reads to a reference genome or genomic region (or assemble the reads de novo) BWA, Bowtie2, etc Then you use a splice-aware aligner, such as TopHat or STAR, to refine the aligments according to coding sequences (exons) using known and/or predicted splice junctions
Quantifying reads per gene • Your aim is to count sequence reads per gene • When mapping reads to genome: • Filter out rRNA, tRNA, mitRNA, etc • Filtering out (or in!) non-coding RNA • Deal with alternative splicing • Deal with overlapping genes, pseudogenes • Small reads mean many short overlaps at one end or the other of intron gaps • Allele specific gene expression
Some Solutions c.f. S. Brown, NYU • Can create a library of transcripts and map reads to transcripts (still have some ambiguity for multiple isoforms) [limited, few(if any) use this method] • Can create a library of splice-junctions (span intron gaps) [Illumina CASAVA uses this method] • Can predict transcripts from genome mapped RNA-seq reads plus known splice junctions plus predicted splice junctions [TopHat] • Can do de novo assembly of new transcripts from reads [Trinity]
Normalization c.f. S. Brown, NYU Coverage is not exactly the same for each sample • Problem: Need to scale RNA counts per gene to total sample coverage • Solution – divide counts per million reads • Problem: Longer genes have more reads, gives better chance to detect DE • Solution – divide counts by gene length • Result = RPKM and later FRKM (Reads/Fragments Per KB per Million)
Better Normalization c.f. S. Brown, NYU • FPKM assumes: • Total amount of RNA per cell is constant • Most genes do not change expression • FPKM is invalid if there are a few very highly expressed genes that have dramatic change in expression (dominate the pool of reads) • Many now use “Quantile” normalization • New normalization methods currently being published • Different normalization methods give different results
Better Normalization quantilenormalization: making distributions identical in statistical properties arrays genes rearrange columns assign ranks arrays genes rank values assign values c.f. S. Brown, NYU
Statistics of Differential Gene Expression c.f. S. Brown, NYU mRNA levels are variable in cells/tissues/organisms over time/treatment/tissue etc. Need enough replicates to separate biological variability from experimental variability If there is high experimental variability, then variance within replicates will be high, statistical significance for DE will be difficult to find. Best methods to discover DE are coupled with sophisticated approaches to normalization Very low expressing genes are tricky: FPKM<1
Gene ExpressionAnalysis Databases: GEO from NCBI ArrayExpress from EBI Commercial software: GeneSpring GX, CLC Bio, many others Free: Mostly R based Not being scared of statistics is an advantage New methods and algorithms continually being published Routine experiments are routine, innovative methods more care The really tricky part is the interpretation of the results
https://github.com/ccsstudentmentors/tutorials/wiki/CCS-Student-Mentors---Tutorialshttps://github.com/ccsstudentmentors/tutorials/wiki/CCS-Student-Mentors---Tutorials
Systems Biology Genome all genes Transcriptome all expressed genes (mRNA) Proteome all translated transcripts (proteins) Metabolome all small molecules Systems biology relies on information in pathways to build a network
Integrating Data Bioinformatics algorithms (seek to) allow large scale mapping of a cell’s known pathways to create a network model. input from various experiments into one model Integrate this model to database updates, literature updates and experimental inputs, bring in added value add user-friendly visualization tools, make it look pretty and you have a powerful setup for understanding how a system works.
Major Problem Integrating data from different sources highlighted differences in • Terminology • Measurements • Experimental platforms • Rigour of cross-referencing citations Databases show inconsistencies in pathway size and annotations, number and identity of of nodes.
Controlled Vocabulary High level organisation of data under umbrella definitions
The Gene Ontology • For each gene or gene product: • Cellular compartment • Molecular function(s) • Biological process • Thus you can start building a picture that can be compared across different species and data types. • It sort of works: important leads that have proven true • Down side: some terms are “part-of” other terms, conditional functions, species groups have their own jargon…
Biological Pathways A series of actions that lead to a certain product or change in the cell. Within a pathway, proteins can be activated, deactivated to various degrees, or completely inactivated. e.g.metabolioc, signalling, gene regulation pathways Reasonably well defined, knowledge on mechanisms incomplete, but it exists. Databases available.
Main Types of Pathways Metabolic pathways (biochemistry) A series of chemical reactions that converts one type of chemical to another. eg glycolysis converts glucose to pyruvate Signaling pathways (molecular biology) A series of binding events, sometimes involving chemical actions (eg phosphorylation), that relay a message. eg MAP-kinase cascade Gene regulation networks (molecular biology/genetics) A series of binding and chemical events that regulate gene expression. eg transcription factor binding, histone deacetylation
Databases abound Most trusted and most commonly used is KEGG Also well cited is the Reactome database BioCarta has nice diagrams There are others; some are species or disease specific (Pathguide has a list, may be slightly outdated)
Biological Networks A network forms when proteins from several pathways work together. Networks link many pathways into a model. e.g. A change in signaling leads to gene regulation which leads to a new (or more or less or somehow different) metabolic product. Delving into the unknown, data driven, “given me the results of these different analyses and let me see what comes up”.
Networks Most work has been in protein-protein interactions. Inferring biological networks, connecting the dots from pathway to pathway, or uncovering links previously not found between protein subsets. Starting with pathway analysis of gene expression…
Pathway Analysis of Gene Expression Data = Gene Set Enrichment Analysis (GSEA) Computational methods of data mining the GO, KEGG, and other databases with gene lists that result from differential gene expression experiments. Given a gene list, how can we classify the genes within it how many are involved in metabolic or signalingpathways? how many are found in the nucleolus? GO which other genes do my genes interact with? are there any transcription factors in my list? what is the probability that this classification is correct? how do our results compare to the literature?
Given a gene list: Which groups of genes are over- or under- represented in my list of genes? • Does my gene list contain a larger than by chance number of cancer-related genes? • Does my gene list contain a larger than by chance number of transcription factors? • Does my gene list contain a smaller than by chance number of genes that affect calcium signaling?
GSEA • Need to start with a gene list, not single genes • Main algorithm 1.) Ranks all genes N using a signal-to-noise metric, e.g. , where A and B are conditions (or a different measure of correlation). 2.) scans pathway S (with Ns genes) and lists against the top- and bottom- scorers in the gene set to determine over- or under- representation, adjusting the scores as it goes along.
GSEA • Creates a running sum statistic calculating an enrichment score ES running through the ranked list of all genes: • If gene jis not in set S (pathway of interest), then subtract from ES • If gene jis in set S, then add • , where • The maximum sum over the whole list is the Enrichment Score ES
GSEA • Estimates a P-value, then uses a correction for multiple testing • (normalisation, then FDR) to obtain a q-value.
Free Tools for Pathway Analysis • There are “hundreds” of tools and algorithms out there - • For complicated investigations, may need a specialist to go through the options and work out a process best suited to your data. • GSEA-P (Subramanian, 2005, http://www.ncbi.nlm.nih.gov/pubmed/17644558) • Pathway Commons • G:profiler • DAVID • Reactome • GenSensorSuite (microarray only) • Flink (NCBI)
Licensed Software for Pathway Analysis Inexpensive Tools Pathway Studio from Elsevier Pathway analysis and literature text mining algorithm More Expensive Tools MetaCore from GeneGo metabolic, signaling and gene regulation maps; can integrate your own data IPA from Ingenuity


