Download
1 / 58
580 likes | 728 Views
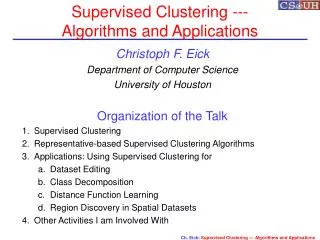
Region Discovery Using Supervised Clustering Algorithms. Kim Keen Wee. Outline. Goals of the Thesis Introduction Supervised Clustering (SC) Fitness Function for Region Discovery An Environment for Region Discovery Experimental Results Conclusion and Future Work. Goals of the Thesis.

E N D
Region Discovery Using Supervised Clustering Algorithms Kim Keen Wee
Outline • Goals of the Thesis • Introduction • Supervised Clustering (SC) • Fitness Function for Region Discovery • An Environment for Region Discovery • Experimental Results • Conclusion and Future Work
Goals of the Thesis • Investigate using Supervised Clustering (SC) Algorithms for region discovery • Design a graphic display program to aid in visualizing the results of region discovery • Create census-based spatial datasets for the state of Wyoming • Analyze and compare the performance of SC algorithms in region discovery
Outline • Goals of the Thesis • Introduction • Supervised Clustering (SC) • Fitness Function for Region Discovery • An Environment for Region Discovery • Experimental Results • Conclusion and Future Work
Introduction • Spatial Data Mining seeks to discover meaningful and interesting patterns from data where a key dimension of data is geographical location • Region Discovery subdivide a territory into different disjoint, contiguous regions minimizing some measure of interestingness
Overview of Clustering • Identify groups of object (or clusters) in a dataset according to their similarity with respect to a particular distance metric • Three types of clustering: unsupervised (or traditional) clustering, semi-supervised clustering, and supervised clustering
Outline • Goals of the Thesis • Introduction • Supervised Clustering (SC) • Fitness Function for Region Discovery • An Environment for Region Discovery • Experimental Results • Conclusion and Future Work
Supervised Clustering (SC) • Representative-based: • Find a set of objects (or representatives) that best represent the objects in a dataset • A solution is a set of representatives • Objects are assigned to the nearest representatives to form clusters • The goal of SC is to find a clustering that minimize the given fitness function or measure of interesting
Supervised Clustering Algorithms Used • SRIDHCR • Single Representative Insertion/Deletion steepest decent Hill Climbing with Randomized Restart algorithm • SCEC • Supervised Clustering using Evolutionary Computation
Outline • Goals of the Thesis • Introduction • Supervised Clustering (SC) • Fitness Function for Region Discovery • An Environment for Region Discovery • Experimental Results • Conclusion and Future Work
Fitness Functions for Region Discovery • Three fitness functions to evaluate region discovery • Traditional SC Fitness Function • Gerrymandering Fitness Function • Reward-based Fitness Function
Traditional SC Fitness Function Tries to maximize purity of clusters while keeping the number of clusters low
Example of Traditional SC Fitness Function • Identify majority class for each cluster • Count minority examples for each cluster
Gerrymandering Fitness Function (1) Seeks for clustering in which a particular class (class of interest) dominates as many clusters as possible while minimizing the imbalance among cluster total of 15 objects: class A has 6 objects, class B has 9 objects Let, class of interest = class A
Gerrymandering Fitness Function (2) • The Gerrymandering fitness function incorporates three different criteria: • Maximize the number of clusters (regions) that are dominated by a particular class • Number of regions specified by user (controlled by parameter β, denotes user-specified number of regions desired) • Maintain equality of population (controlled by parameter ζ)
Reward-based Fitness Function (1) • Evaluates a clustering based on the density of a class of focus C and assigns rewards to regions in which the distribution of class C significantly deviates from the prior probability of class C in the whole dataset. • The quality of a clustering qC(X) is the sum of the rewards τC(c) associated with each cluster c in X • Reward is higher for larger cluster using β=1
Example of Reward-based Fitness Function Parameters: γ1=0.5, γ2=1.5, R+=1, R-=1,β=1.1 Prior(Poor)=0.2 n=1000 p(c1,Poor)=20/50 = 0.4 p(c2,Poor)=40/200 = 0.2 p(c3,Poor)=10/200 = 0.05 p(c4,Poor)=30/350 = 0.0857 p(c5,Poor)=100/200 = 0.5 c3,c4 0.1 c2 0.3 c1,c5 qPoor(X) = (1/7 x 50)1.1/1000 + 0 + (1/2 x 200)1.1/1000 + (0.143 x 350)1.1/1000 + (2/7 x 200)1.1/1000 = 0.00869 + 0 + 0.15849 + 0.07402 + 0.08564 = 0.32684 0.4-0.3 0.7 0.1-0.05 0.1
Outline • Goals of the Thesis • Introduction • Supervised Clustering (SC) • Fitness Function for Region Discovery • An Environment for Region Discovery • Experimental Results • Conclusion and Future Work
An Environment for Region Discovery Spatial Datasets Fitness Functions Support Graphic Display Tool RSC Algorithms Environment for Region Discovery
Outline • Goals of the Thesis • Introduction • Supervised Clustering (SC) • Fitness Function for Region Discovery • An Environment for Region Discovery • Experimental Results • Conclusion and Future Work
Objectives of the Experiments • To illustrate how SRIDHCR and SCEC work in region discovery for four Wyoming state spatial datasets and two artificial spatial datasets • To evaluate the performance of SRIDHCR and SCEC with three individual fitness functions in region discovery • To study how parameters values of the three fitness functions affect the clustering results (regions discovered) and to select a set of good parameters for the fitness functions • To analyze and compare the performances of SRIDHCR and SCEC in region discovery
Datasets Used in the Experiments • Artificial Datasets: Matlab datasets • Wyoming Datasets are created based on U.S. Bureau Census
Step 1: Obtain Boundary File of the State Step 2: Preprocess the Boundary File Step 3: Get Report of Census 2000 on Selected State (by County) Step 4: Generate Random Population (by County) Step 5: Associate Class Label Based on Census Data Step 6: Combine all Counties Six-Step Process for State Spatial Datasets Creation Creation of Wyoming Datasets
Original Wyoming Datasets (Census 2000) Household Income in 1999 Poverty Status in 1999 Age Race
Wyoming Poverty Dataset and Modified Poverty Dataset Wyoming Poverty Dataset Modified Poverty Dataset
Example Output of Clustering • Each color represent a cluster • Classes are represented by different shape of point • Representatives are circled in white
Clustering using Traditional SC Fitness Function
SCEC – Traditional SC Fitness Function (1) • Clustering Output of Modified Poverty Dataset (parameter: β=0.3)
SCEC – Traditional SC Fitness Function (2) • Clustering Output of Modified Poverty Dataset (parameter: β=0.1)
SRIDHCR – Traditional SC Fitness Function • Clustering Output of Modified Poverty Dataset (parameter: β=0.1)
Clustering using Gerrymandering Fitness Function
SCEC – Gerrymandering Fitness Function (1) • Clustering Output of Wyoming Age Dataset(parameters: ǩ=7, β=30000, ζ=0.01) 5 7
SCEC – Gerrymandering Fitness Function (2) • Clustering Output of Wyoming Age Dataset(parameters: ǩ=12, β=30000, ζ=0.01) 10 12
SCEC – Gerrymandering Fitness Function (3) • Clustering Output of Wyoming Age Dataset(parameters: ǩ=12, β=30000, ζ=0.08) 7 12
SRIDHCR – Gerrymandering Fitness Function (1) • Clustering Output of Wyoming Age Dataset(parameters: ǩ=12, β=30000, ζ=0.01) 11 12
SRIDHCR – Gerrymandering Fitness Function (2) • Clustering Output of Wyoming Age Dataset(parameters: ǩ=12, β=30000, ζ=0.08) 8 12
Clustering using Reward-based Fitness Function
SCEC – Reward-based Fitness Function (2) • Clustering Output of Wyoming Poverty Dataset (parameters: γ1=0.5, γ2=1.5, R+=10, R-=10, β=1.1)
SCEC – Reward-based Fitness Function (3) • Clustering Output of Modified Poverty Dataset (parameters: γ1=0.5, γ2=1.5, R+=10, R-=10, β=1.1)
SCEC – Reward-based Fitness Function (4) • Clustering Output of Wyoming Income Dataset: class of interest-class 1 (parameters: γ1=0.5, γ2=1.5, R+=10, R-=10, β=2)
SCEC – Reward-based Fitness Function (5) • Clustering Output of Wyoming Income Dataset: class of interest-class 4 (parameters: γ1=0.5, γ2=1.5, R+=10, R-=10, β=2)
SCEC – Reward-based Fitness Function (6) • Clustering Output of Wyoming Income Dataset: class of interest-class 4 (parameters: γ1=0.5, γ2=1.5, R+=10, R-=0, β=1.1)