Download
1 / 1
10 likes | 134 Views
Willow-Farm Rockman Ivanhoe Aa , SCE: 6. Cass-River Select Delegate Aa , SCE: 15. Wedgwood Laramie aa , SCE: 15. Conclusions. Results & Discussion. Table 1. Sequencing metrics. Materials and Methods. Introduction.

E N D
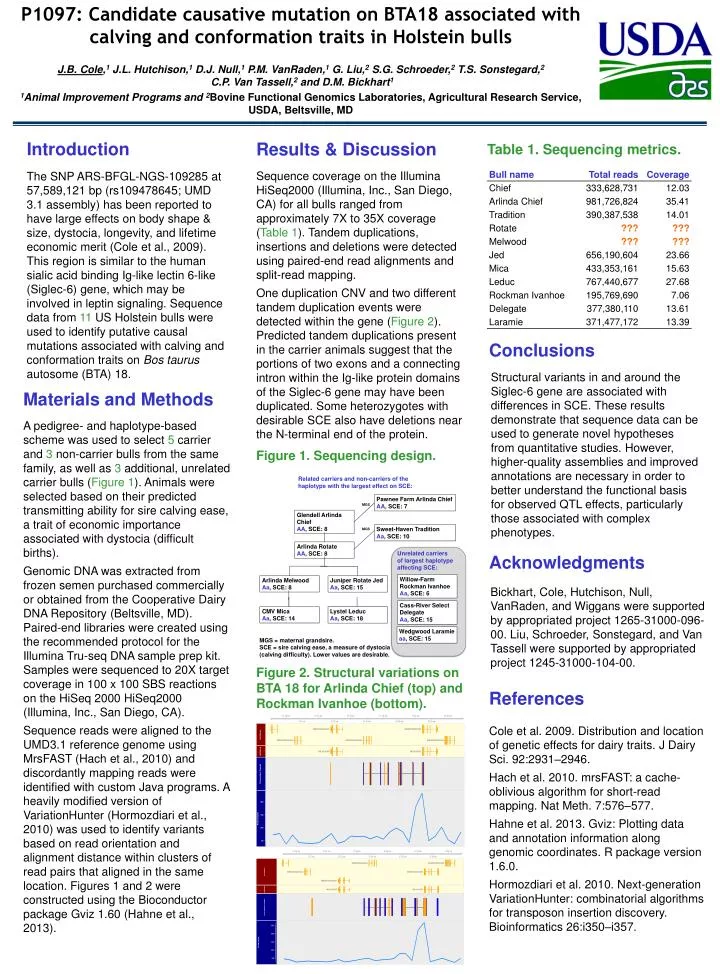
Willow-Farm RockmanIvanhoe Aa, SCE: 6 Cass-River Select Delegate Aa, SCE: 15 Wedgwood Laramie aa, SCE: 15 Conclusions Results & Discussion Table 1. Sequencing metrics. Materials and Methods Introduction Structural variants in and around the Siglec-6 gene are associated with differences in SCE. These results demonstrate that sequence data can be used to generate novel hypotheses from quantitative studies. However, higher-quality assemblies and improved annotations are necessary in order to better understand the functional basis for observed QTL effects, particularly those associated with complex phenotypes. Sequence coverage on the Illumina HiSeq2000 (Illumina, Inc., San Diego, CA) for all bulls ranged from approximately 7X to 35X coverage (Table 1). Tandem duplications, insertions and deletions were detected using paired-end read alignments and split-read mapping. One duplication CNV and two different tandem duplication events were detected within the gene (Figure 2). Predicted tandem duplications present in the carrier animals suggest that the portions of two exons and a connecting intron within the Ig-like protein domains of the Siglec-6 gene may have been duplicated. Some heterozygotes with desirable SCE also have deletions near the N-terminal end of the protein. A pedigree- and haplotype-based scheme was used to select 5 carrier and 3 non-carrier bulls from the same family, as well as 3 additional, unrelated carrier bulls (Figure 1). Animals were selected based on their predicted transmitting ability for sire calving ease, a trait of economic importance associated with dystocia (difficult births). Genomic DNA was extracted from frozen semen purchased commercially or obtained from the Cooperative Dairy DNA Repository (Beltsville, MD). Paired-end libraries were created using the recommended protocol for the IlluminaTru-seq DNA sample prep kit. Samples were sequenced to 20X target coverage in 100 x 100 SBS reactions on the HiSeq2000 HiSeq2000 (Illumina, Inc., San Diego, CA). Sequence reads were aligned to the UMD3.1 reference genome using MrsFAST (Hach et al., 2010) and discordantly mapping reads were identified with custom Java programs. A heavily modified version of VariationHunter (Hormozdiari et al., 2010) was used to identify variants based on read orientation and alignment distance within clusters of read pairs that aligned in the same location. Figures 1 and 2 were constructed using the Bioconductor package Gviz 1.60 (Hahne et al., 2013). The SNP ARS-BFGL-NGS-109285 at 57,589,121 bp(rs109478645; UMD 3.1 assembly) has been reported to have large effects on body shape & size, dystocia, longevity, and lifetime economic merit (Cole et al., 2009). This region is similar to the human sialic acid binding Ig-like lectin6-like (Siglec-6) gene, which may be involved in leptin signaling. Sequence data from 11 US Holstein bulls were used to identify putative causal mutations associated with calving and conformation traits on Bostaurus autosome (BTA) 18. Related carriers and non-carriers of the haplotype with the largest effect on SCE: Unrelated carriers of largest haplotype affecting SCE: Pawnee Farm ArlindaChief AA, SCE: 7 MGS Figure 1. Sequencing design. GlendellArlindaChief AA, SCE: 8 Sweet-Haven Tradition Aa, SCE: 10 MGS ArlindaRotate AA, SCE: 8 CMV Mica Aa, SCE: 14 ArlindaMelwood Aa, SCE: 8 Juniper Rotate Jed Aa, SCE: 15 LystelLeduc Aa, SCE: 18 MGS = maternal grandsire. SCE = sire calving ease, a measure of dystocia(calving difficulty). Lower values are desirable. Figure 2. Structural variationson BTA 18 for Arlinda Chief (top) and Rockman Ivanhoe (bottom). Acknowledgments • Bickhart, Cole, Hutchison, Null, VanRaden, and Wiggans were supported by appropriated project 1265-31000-096- 00. Liu, Schroeder, Sonstegard, and Van Tassell were supported by appropriated project 1245-31000-104-00. References • Cole et al. 2009. Distribution and location of genetic effects for dairy traits. J Dairy Sci. 92:2931–2946. • Hach etal. 2010. mrsFAST: a cache-oblivious algorithm for short-read mapping. Nat Meth. 7:576–577. • Hahne et al. 2013. Gviz: Plotting data and annotation information along genomic coordinates. R package version 1.6.0. • Hormozdiari et al. 2010. Next-generation VariationHunter: combinatorial algorithms for transposon insertion discovery. Bioinformatics 26:i350–i357.