Download
1 / 45
470 likes | 709 Views
Using a Graphing Calculator. TI-83’s and TI-84’s. Using a Graphing Calculator. Probability. Applications. Coin Toss Applications. <ESC> to move to previous screen. <TOSS> to toss one coin and access more tosses. <SET> to get to the Settings screen

E N D
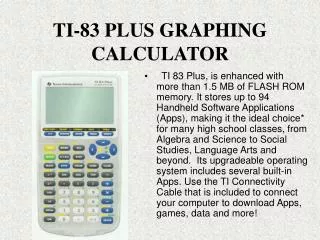
Using a Graphing Calculator TI-83’s and TI-84’s
Using a Graphing Calculator Probability
Coin Toss Applications <ESC> to move to previous screen. <TOSS> to toss one coin and access more tosses. <SET> to get to the Settings screen <DATA> to store the collected data to a list. <TABL> shows a table of the trials, <GRPH> shows a graph of the trials.
Coin Toss Applications • Press <ADV> from the Settings screen to change the weight of the coins. • Currently, the coins are equally weighted. • Press <OK> when have the settings and weight for the simulation are appropriate. Next, press <TOSS>.
Coin Toss Applications One coin will toss. Now, press <+1>, <+10> or <+50> depending on the data to be collected. The Frequency Graph updates as the coins toss. Press <ESC> when finished tossing the coins for this simulation.
Parking Lot Simulation Part 1: An attendant must park 32 different cars. He has a choice of five different parking lots in which to park them. He decides to make it a game. Each time he encounters a “STOP” sign, he flips a coin to determine which way he will turn. If the coin lands heads-up, he turns to the right. If the coin lands tails-up, he turns to the left. What parking lot would you expect to have the greatest number of cars? Why? What parking lot would you expect to have the least number of cars? Why?
Parking Lot Simulation Part 2: You are the parking attendant. Place a car (marker) at the starting point. Move the marker down until you encounter a “STOP” sign. Remember, in order to determine which way to turn, you must flip a coin (heads=right, tails=left). Continue to move the marker down toward the parking lots, stopping at each “STOP” sign and flipping the coin to determine which way to turn. Upon reaching a parking lot, shade in one section of the appropriate bar graph. Continue this process until you have parked all thirty-two cars.
Parking Lot Simulation Part 3: • What fraction of the cars are in each of the following lots: Lot 1: _____ Lot 2: _____ Lot 3: _____ Lot 4_____ Lot 5_____ • In which lot(s) did you find the greatest number of cars? Is this what you predicted? • In which lot(s) did you find the least number of cars? Is this what you predicted? • Using what you know about probability, why do you think some parking lots have more cars than other parking lots? • If you had to park one more car, in which lot would you expect it to be parked? Why?
Rolling Dice – Rain or Shine? • Think about: • How well can you predict what the weather will be tomorrow? • How well can you predict what the weather will be next week? • How well can you predict how many sunny days there will be next month?
Roll a 1,2,3, or 4 stays sunny. • Roll a 5 or 6 go to rain Roll a 1,2, or 3 stays rainy. Roll a 4,5, or 6 go to sunny Roll a 1,2, or 3 stays rainy. Roll a 4,5, or 6 go to sunny Rolling Dice – Rain or Shine? • Before • (look at simulation to the right to answer) • How many days do you think will be sunny? Explain your answer. • How many days do you think will be rainy? Explain your answer.
Rolling Dice – Rain or Shine? Simulation: You are going to start with a sunny day. Roll one die to find out what the weather is the next day. You will keep track for one month (31days).
Rolling Dice – Rain or Shine? • After the simulation • How many days were sunny? • How many days were rainy? • How close were your predictions? • Change the model to make a simulation where it rains more than it shines.
Rolling Dice – Rain or Shine? • After the simulation • Change the model to make a simulation where the weather changes a lot. • Change the model to make a simulation where it is usually sunny but when it rains it rains for a long time.
Rolling Dice – Cookie Bin Problem: The Cookie Bin is a small shop that bakes and sells cookies at an indoor shopping mall. The owner plans to introduce a new bite-sized chocolate- chip cookie, to be called "Chippies," to her line of products. She would like to have each cookie contain at least five chocolate chips. To minimize the cost of ingredients, she wants to determine the least number of chocolate chips that need to be mixed into a batch of dough for a dozen Chippies so as to meet the five-chip-per-cookie minimum. How many chocolate chips -should she use for each batch?
Rolling Dice – Cookie Bin Analysis: Assume that each chip placed into the dough for one dozen cookies has an equally likely chance of ending up in anyone of the twelve cookies made from that batch. One approach to solving this problem is to simulate the random placement of chocolate chips into the individual cookies in the batch.
Rolling Dice – Cookie Bin Since each cookie should contain at least five chips, at least sixty chocolate chips must be mixed into the cookie dough. A dodecahedral (12-sided) die can: be rolled to determine which of the cookies is to get a given chocolate chip. By rolling the die at least sixty times and recording each result, we can determine the number of cookies containing five or more chips.
Rolling Dice – Cookie Bin A picture of twelve Chippies, without chocolate chips, is shown. Roll a dodecahedral die exactly sixty times and record each result by drawing a dot (chocolate chip) on the cookie corresponding to that roll. After the sixty chocolate chips have been randomly placed, determine the number of cookies that contain five or more chips.
Prob Sim Questions????
Statistics on a graphing calculator Data Lists M3R Box Plots Scatter Plots
Entering Data into a list • To access this list press STAT and choose EDIT and then press ENTER.
Calculating M3R • After entering data into a list, go back to the home screen, 2nd MODE. • Select 2ndSTAT and use the blue arrows to move over to MATH
Calculating Mean and Median Arrow down to mean( or press 3 for the mean or median( or press 4 for the median. The calculator is now waiting for you to tell it which list to calculate. There are two ways to choose a list. 1.) Press 2ndSTAT and select the appropriate list and press ENTER twice or 2.) Press 2nd and one of the numbers 1 - 6 for L1 – L6 and press ENTER.
Calculating Range Arrow down to max (list name) – min (list name) and press ENTER.
Calculating Mode From the home screen, press STAT and arrow down to SortA( (ascending) or SortD( (descending) and press ENTER.
Calculating Mode The calculator is now waiting for you to tell it which list to sort. There are two ways to choose a list. 1.) Press 2ndSTAT and select the appropriate list and press ENTER twice or 2.) Press 2nd and one of the numbers 1 - 6 for L1 – L6 and press ENTER.
Calculating Mode To see the sorted data, press STAT and select EDIT and the list will now be sorted. Use the arrow keys to scroll through the list to find the mode.
Calculating One-Variable Stats • Press the STAT key and use the blue arrow to move to CALC. Select 1-Var Stats and press ENTER.
Calculating One-Variable Stats • The calculator is now waiting for you to tell it which list to calculate. There are two ways to choose a list. 1.) Press 2nd STAT and select the appropriate list and press ENTER twice or 2.) Press 2nd and one of the numbers 1 - 6 for L1 – L6 and press ENTER. Use the blue arrow keys to scroll up or down to see all of the statistics.
Calculating One-Variable Stats x Mean Average of Set x Sum of the Elements of the Set n Total Number of Elements in the Set minX Minimum Value Q1 Lower Quartile Med Median Q3 Upper Quartile MaxX Maximum Value Sx Sample Standard Deviation of x x Population Standard Deviation of x
Creating a Box Plot Enter data in a List access the box and whisker plot in the STAT PLOT screen, press 2ndY=.
Creating a Box Plot Highlight the ON function, choose the type of box and whisker plot (outliers or no outliers), and choose the list that your data is located. Make sure that the Xlist is assigned to the appropriate list of data.
Creating a Box Plot Repeat this procedure to display more than one box and whisker plot at one time. To display your graph, press ZOOM, then select ZOOM STAT to automatically adjust the window for the entered statistics.
Creating a Scatter Plot To access the scatter plot in the STAT PLOT screen, press 2ndY=. Highlight the ON function and choose the first type of graph. Make sure that the Xlist and Ylist is assigned to the appropriate lists of data.
Creating a Scatter Plot To display your graph, press ZOOM, then select ZOOM STAT to automatically adjust the window for the entered statistics.
TI- Stats Questions ???
TI- Activities http://education.ti.com/calculators/timath/