Download
1 / 48
480 likes | 708 Views
Fuel Cells An Emerging High-Technology Industry. Rodger McKain, PhD 4/22/2006. Energy Sets the Scene. Setting the Scene for Fuel Cells: Petroleum supply, consumption, and imports, 1970-2025 (million barrels per day). 13 million Bbls/d. US EIA 2005.

E N D
Fuel Cells An Emerging High-Technology Industry Rodger McKain, PhD 4/22/2006
Setting the Scene for Fuel Cells: Petroleum supply, consumption, and imports, 1970-2025 (million barrels per day) 13 million Bbls/d US EIA 2005
Setting the Scene for Fuel Cells: Petroleum supply, consumption, and imports, 1970-2025 (million barrels per day) 60% 71% US EIA 2005
Primary energy use by fuel, 2003-2025 (quadrillion Btu) 1 quad = 170 million bbls = 1 trillion SCF (nat gas) = 45 million tons (coal)
Fuel Cells: An Old Technology Provides New Solutions
First Communication of Fuel Cell Related Phenomena “I cannot but regard the experiment as an important one…” William Grove to Michael Faraday October 22, 1842
SOFC Fuel Cell Operation 2 H+ + O2- H2O + 2 e- External electrical conducting circuit 2e- H2 H2O + 2 e- O2- O2 2O2- ½ O 2 + 2 e- H2 2 H+ + 2e- Porous perovskite cathode Porous nickel-cermet anode Solid Oxide Electrolyte – ionic conducting membrane
Increasing Temperature Fuel Cell Operation H2 + ½ O2 H2O H2O O + 2e_ O= H2 + O=_ 2e_ H2O (Ionic transport) Source: U.S. Fuel Cell Council
Attributes of Fuel Cells AFC PACFPEMMCFCSOFC Electrolyte KOH Phosphoric Sulfonic Molten Y2O3-ZrO2 Acid Acid Carbonate Ceramic Polymer Salt Temperature 1000C 2000C 80 0C 6500C 800-10000C Fuel H2 H2 H2 H2/CO H2/CO Efficiency (H2 fuel) 60% 55% 60% 55% 55% (NG fuel) -- 40% 35% 50% 50% Pollution Low Low Low Low Low Hydrocarbon No Difficult Difficult Yes Yes Fuel Use Start-Up Fast Moderate Fast Slow Slow Zirconia
Useful heat Heat Management Fuel cell Stack Sub Assembly Fuel FuelProcessor PowerConditioner A.C. Power Air Controls Fuel Cell Power System
Fuel Cell Impact (from Hydrogen Economy Statements) • Clean environment • Reduced Global Warming • Energy independence • National Infrastructure Security • Low cost, reliable electrical power
Regulated Emissions Comparison:Coal Fired Utility vs. PA Fuel Cell
Fuel Cell System Trends Compared with other Distributed Generation Technologies 70 Combined Cycle 60 Carbonate Fuel Cell Solid Oxide Fuel Cells 50 PAFC Aero Gas Turbines 40 Electrical Generation Efficiency %LHV PEM Fuel Cell 30 Industrial Gas Turbine 20 IC Engines Stirling Engine 10 Microturbines 0 1 10 100 1,000 10,000 100,000 500,000 Residential Commercial Industrial Wholesale Size in kW
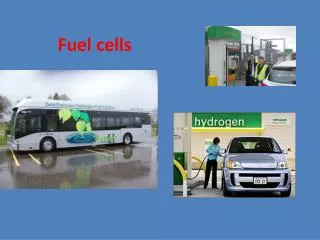
Hydrogen Production • Principle Sources of Hydrogen • Hydrocarbons (natural gas and crude oil) • Water • Conversion Technology • Steam Methane Reforming (commercial) • Water Electrolysis (commercial) • Methane Pyrolysis (small scale) • Water-Sulfur-Iodide Process (small scale)
Hydrogen Production Dilemma • 13 million barrels crude oil per day used in transportation – equivalent to 1.46 billion pounds per day hydrogen • This would require doubling the total US power production (850 GWe to 1780 GWe) if hydrogen were produced by conventional electrolysis. (assume 1 MW per 1000 lbs and efficiency improvements) OR • This would require 23 trillion cubic feet of natural gas per year - approximately 110% of the 2002 total US consumption, nearly doubling the total natural gas requirement.
Hydrogen Production Solutions • Near Term (small volumes) • Conventional technology distributed to point of use • Fueling stations (hydrocarbon reforming or water electrolysis) • Long Term (large volumes) • High Temperature gas Cooled Nuclear Reactor – boost electrolysis efficiency from 20+% to 40+%. (Reduce power requirement by half) • FutureGen – Hydrogen and power from coal • Solar Cell Direct Electrolysis
Are Fuel Cell Powered Cars Really More Efficient? 40 100 Energy Units IC Engine 40% Power Train 37.5% 15 Conventional Car 60 20 Idling 5 Friction - 60 Units H2 production 20 40 Energy Units Fuel Cell 50% Direct Drive 75% 15 Fuel Cell Car 20 0 Idling 5 Friction
Technology Commercialization Conundrum • Public Expectations are high • But, Success Rates are less than 30% • And, Success generally takes longer and costs more • Fuel Cell system OEM’s will determine the future • Much more investment is required • Development phase is more costly than anticipated • Strategic development is likely to dominate • But, focus is on suppliers and entrepreneurs • Basis for a hard, clear-eyed review of the fuel cell opportunity • Role of OEM’s • Public expectations • Government and NPO involvement
When Will Fuel Cells Be Available?(An Ohio View) Source: Projections represent Taratec Corporation’s estimate of market activity”based on input from industry analysts and information provided in executive interviews.
Today’s Technology Cost Comparison Watts Sector Application $/kW 0.1 – 1.0 Biomedical Autonomous power for 105 sensors and implants 1 – 100 Electronics Battery replacement 104 100 - 10,000 Communications Battery replacement 103 – 104 Cell tower stationary power 5,000 - Transportation Propulsion 101 – 102 100,000 Auxiliary Power Units > 10,000 Stationary power Emergency backup 102 – 103 grid supplement
Market Projections Portable Power leads the way Military/Aerospace Vehicle Stationary Auxiliary Portable
Public Expectations • Set by “soft industry” successes • Dominated by services sector and incremental changes to existing businesses • Low development costs • Investment usually for revenue growth • Less than 5 years for acceptable ROI • Satisfying unmet market needs (existing markets) • Returns through M&A’s or IPO’s • Not universally applicable
Years Since Commercial Introduction Market Penetration (Per Cent Households) Time to Max. TV – 30 yrs Color TV – 10 yrs Electricity – 75 yrs Automobile – 80 yrs Telephone – 90 yrs Cell phone – 20 yrs PC – 20 yrs Internet – 15 yrs
Fuel Cell vs. Service Sector Commercialization • Some Fuel Cells are here today • Battery replacement • Military • Space Shuttle • Back-up power But, to impact domestic energy consumption: • FC’s require • 10-100X development funding $100-200 million per product (from now) – 10X development time (20 yrs) But, FC’s offer similar market opportunities ($20 billion) to service sector businesses
Fuel Cell Commercialization Cost Comparison Fuel Cells Log [$] Service Sector Log [yrs]
Service Sector vs. Fuel Cell Commercialization 2000 Service Fuel Cells DCF ( million $) 0 10 20 Yrs from 2006 -200 • Differentiators • Infrastructure • Capital intensity • Market Creation • Diversity • Competitive Alternatives
Fuel Cell Cost Pyramid (DOE) Cost Contribution $/kW Industrial Segments Now Future Balance of Plant Packaging,Air/Fuel Handling 46 6% 44 12% Controls/Power Electronics Inverter, DC Boost,Sensors, Actuators 128 19% 110 28% 27% Hot Box Reformer, Recuperator Manifold, Filter, enclosure/insulation 184 109 28% Stack 325 48% 118 30% 683 382
Fuel Cell Business Creation Gap • This time around----20-year development cycle (profitable industry following silicon chip history) • Suppliers betting on system integrators • System integrators require large infusions of capital to advance to product stage…the bottleneck in the cycle...returns are still beyond the horizon. • Gap: Financing development for an uncertain market.
Years Since Commercial Introduction Fuel Cells? 2005-2060
FC’s Early Adopter Chasm (Created by Government Development Programs) • Early demand for components • OEM’s commercial development • lags demonstration gov programs • Transition to commercial prototypes • Renewed demand as OEM’s • book product sales Revenue Chasm DCF [$] Years
How does a fuel cell business survive and thrive? • Military “bootstrap” • Federal agency funding • Private investors • Strategic partners/customers • Leveraging Resources
Building an Industry General Requirements • Source(s) of ideas • Availability of funds • Accessible Workforce • Education and Training Resources • Informed and supportive infrastructure • Competitive business environment • Regulations, Taxation, Financing etc.
Critical Role for Building a Fuel Cell Industry in Ohio • Educate Policymakers • Create realistic expectations • Facilitate information exchange • Inform the public • Engage all interests • Create opportunities • Focus on government-University-Industry Relationships • Maintain an independent perspective • Enable new and existing companies to access resources to pursue fuel cell business plans more aggressively in Ohio than anywhere else
Concept: Truck Auxiliary Power Units Save 700 Million Gallons Diesel Fuel per Year Long-haul trucks idle about 2,000 hours per year Idling trucks consume 860 Millions gallons of fuel per year! Fuel cells can reduce truck idling fuel consumption from 1 gal/hr to 0.2 gal/hr or by 688 million gallons.
Benefits to commercial aircraft cabin power 50% fuel savings over conventional turbine APU Reduced emissions (e.g., >20% NOx reduction) Reduced noise (>10db reduction at gate) Concepts: Aircraft Power Systems Commercial Aircraft Benefits to UAVs: • Emergency power – improved vehicle recovery • Payload power – significant increase in payload Unmanned Aerial Vehicle Benefits to HALE UAVs: • Longer mission endurance • Higher payloads NASA LEAP Project (Low Emissions Alternative Power) High-Altitude, Long Endurance UAV
Cost: (capital and operating) – further breakthroughs? Operating Life: 4000 – 40,000 hours (automotive vs. stationary power) Reliability Investment – Catch 22? Many demonstrations Hydrogen Infrastructure (fuel transportation and storage) Codes and Standards Challenges for Widespread Use of Fuel Cells
Ohio Interests NASA Glenn Parker Hannifin GrafTech CAPI Battelle Increasing Temperature HydroGen AMPOhio NexTech MetaMateria SOFCo-EFS TMI CWRU-First Energy NASA Glenn Fuel Cell Types Source: U.S. Fuel Cell Council
Ohio Fuel Cell Coalition – Ken Alfred Wright Fuel Cell Group – John McGrath NorTech – Dorothy Baunach CWRU – Bob Savinell, Tom Zawodzinski OSU – Giorgio Rizzoni CSU – Orhan Talu U of Toledo – Martin Abraham U of Akron – Steven Chuang Ohio University – Dave Bayless NASA Glen – Serene Farmer Wright Patterson AFRL – Tom Reitz Battelle – Dave Salay EMTEC – Frank Svet, Mike Martin EWI – Frank Jacob Stark State College of Technology – Dorey Diab Hocking College Catacel – Bill Whittenberger MetaMateria Partners – Dick Schorr NexTech Materials – Bill Dawson SOFCo-EFS – Rodger McKain TMI – Benson Lee Parker-Hannifin AEP First Energy Dana Corporation Rockwell International Keithley Instruments Solarflo Vanner Governor Bob Taft Ohio Department of Development – Pat Valente, Mike McKay Stark County Development Board – Steve Paquette Congressman Regula The Ohio Fuel Cell Enterprise Thank You!