Download
1 / 31
310 likes | 479 Views
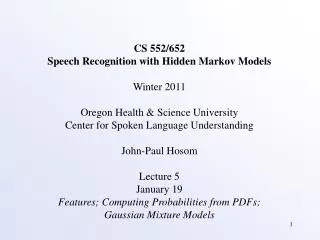
CS 552/652 Speech Recognition with Hidden Markov Models Winter 2011 Oregon Health & Science University Center for Spoken Language Understanding John-Paul Hosom Lecture 5 January 19 Features; Computing Probabilities from PDFs; Gaussian Mixture Models. Review: HMMs.

E N D
CS 552/652 Speech Recognition with Hidden Markov Models Winter 2011 Oregon Health & Science University Center for Spoken Language Understanding John-Paul Hosom Lecture 5 January 19 Features; Computing Probabilities from PDFs; Gaussian Mixture Models
Review: HMMs • Elements of a Hidden Markov Model: • clock t = {1, 2, 3, … T} • N states Q = {q1, q2, q3, …, qN} • M events E = {e1, e2, e3, …, eM} • initial probabilities πj = P[q1 = j] 1 j N • transition probabilities aij = P[qt = j | qt-1 = i] 1 i, j N • observation probabilities bj(k)=P[ot = ek | qt = j] 1 k M bj(ot)=P[ot = ek | qt = j] 1 k M • Entire Model: = (A,B,π) The probability of both O and q occurring simultaneously is: which can be expanded to:
P( )=0.6 P( )=0.3 P( )=0.1 P( )=0.3 P( )=0.4 P( )=0.3 P( )=0.1 P( )=0.2 P( )=0.8 Review: HMMs • Example: Weather and Atmospheric Pressure 0.2 0.6 0.3 M H 0.4 0.1 0.7 0.1 0.5 L H= 0.4 M= 0.2 L = 0.4 0.4
Review: HMMs • Example: Weather and Atmospheric Pressure • What is probability of O={sun, sun, cloud, rain, cloud, sun} • and the sequence {H, M, M, L, L, M}, given the model? • = H·bH(s) ·aHM·bM(s) ·aMM·bM(c) ·aML·bL(r) ·aLL·bL(c) ·aLM·bM(s) • = 0.4 · 0.8 · 0.3 · 0.3 · 0.2 · 0.4 · 0.5 · 0.6 · 0.4 · 0.3 · 0.7 · 0.3 • = 1.74x10⁻⁵ • What is probability of O={sun, sun, cloud, rain, cloud, sun} • and the sequence {H, H, M, L, M, H}, given the model? • = H·bH(s) ·aHH·bH(s) ·aHM·bM(c) ·aML·bL(r) ·aLM·bM(c) ·aMH·bH(s) • = 0.4 · 0.8 · 0.6 · 0.8 · 0.3 · 0.4 · 0.5 · 0.6 · 0.7 · 0.4 · 0.4 · 0.8 • = 4.95x10⁻⁴
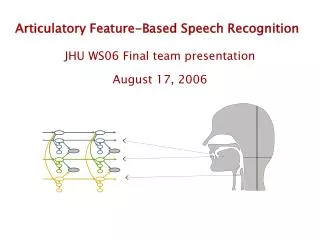
Features: Overview Let’s go back and look at bj(ot), the probability of (generating) observation ot given that we’re in state j. What is ot? It’s an “observation” of some event. What does thatmean for HMMs? Just like in DTW, the speech signal is divided into T frames (for each time point 1 … T); typically one frame occurs every 10 msec. At each frame, a vector of features is computed. These features should provide the ability to discriminate between phonemes. These features are the observations, ot. T=80 • Each vertical line delineates one observation, ot
1.0 0.0 N-1 Features: Windowing In many cases, the math assumes that the signal is periodic. However, when we take a rectangular window to extract an observation at one frame, we have discontinuities in the signal at the ends. So we can window the signal with other shapes, making the signal closer to zero at the ends. Hamming window: Typical window size is 16 msec, which equals 256 samples for 16-kHz (microphone) signal and 128 samples for 8-kHz (telephone) signal. Window size does not have to equal frame size!
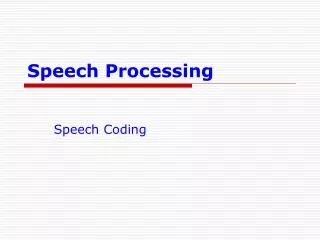
Features: Spectrum and Cepstrum (log power) spectrum: 1. Hamming window 2. Fast Fourier Transform (FFT) 3. Compute 10 log10(r2+i2) where r is the real component, i is the imaginary component
Features: Spectrum and Cepstrum cepstrum: treat spectrum as signal subject to frequency analysis… 1. Compute log power spectrum 2. Compute FFT of log power spectrum 3. Use only the lower 13 values (cepstral coefficients)
Features: Overview Again time domain spectral domain cepstral domain Time (msec) (spectrum and cepstrum image from A.M. Noll, 1967)
Features: Overview Again • Features = observations = data points = ot • Features are representations of speech signal at one point in time. • Features can be frequencies of resonant energies (talked about in CS551), or samples of the power spectrum (used in Project 1), or cepstral features (talked about now). In all cases, features are vectors of real numbers: Formants (Hz) Power Spectrum (dB) Cepstrum c0 c1 c2 c3 … 0 Hz 200 Hz 400 Hz 600 Hz 800 Hz 1000 Hz … 3400 Hz 3600 Hz 3800 Hz 0.2968 0.3998 0.3379 0.4135 0.5608 0.5347 … -0.0973 0.0100 -0.0544 F1 F2 F3 312 2300 3200 c11 c12
Review: Vector Quantization • Vector Quantization (VQ) is a method of automatically partitioning a feature space into different clusters based on training data. • Given a test point (vector) from the feature space, we can determine the cluster that this point should be associated with. • A “codebook” lists central locations of each cluster, and gives each cluster a name (usually a numerical index). • This can be used for data reduction (mapping a large numberof feature points to a much smaller number of clusters), or for probability estimation.
Review: Vector Quantization • Other states have their own data, and their own VQ partition • Important that all states have same number of code words • For HMMs, compute the probability that observation ot is generated by each state j. Here, there are two states, red and blue: bblue(ot) = 14/56 = 1/4 = 0.25 bred(ot) = 8/56 = 1/7 = 0.14
1 2 3 4 5 6 7 8 9 10 11 12 13 Vector Quantization • Features observations, probability of feature = bj(ot) • However, quantization error can arise when modeling a continuous signal (feature space) with discrete units (clusters) • What happens to p(x) if feature space moves back and forth between bins 3 and 4? What about between bins 5 and 6? • What probability value do we use in bin 7? Should the value be 0? • In addition, initialization can influence the location and histogram counts of the final clusters… want more robustness p(x) x
p(x) 1 2 3 4 5 6 7 8 9 10 11 12 13 x Continuous Probability Distribution • What we want is a smooth, robust estimate of p(x) (and bj(ot))!! • How about this: • Now, small movement along x axis has smooth, gradual effect on p(x). The value at bin 7 is close to, but not, zero. • Still a question about initialization… we’ll address that later.
p(x) x Continuous Probability Distribution • One way of creating such a smooth model is to use a mixture of Gaussian probability density functions (p.d.f.s). • The detail of the model is related to the number of Gaussian components • This Gaussian Mixture Model (GMM) is characterized by (a) the number of components, (b) the mean and standard deviation of each component, (c) the weight (height) of each component • One remaining question: how to compute probabilities from p.d.f. at one point (a single x value)
Computing Probabilities From Probability Density Functions • The probability of an event is computed as the integral of the p.d.f. over a range of values. Therefore, a p.d.f. is a plot of the change in probability at each x (time) point. The units on the vertical axis are probability-per-x-unit. • Example 1:I am waiting for an earthquake. All I know is that it could happen at any time, but it will definitely happen within the next 100 years. My time scale is in years. What is the p.d.f.of an earthquake? • The y axis is in units of probability-of-earthquake-per-year. The probability of an earthquake within 100 years is 1.0. The probability of an earthquake within the next 40 years is 0.4 0.01 0 100
Computing Probabilities From Probability Density Functions • Example 2:I am waiting for an earthquake. All I know is that it could happen at any time, but it will definitely happen within the next 100 years. My time scale is in days. What is the p.d.f.of an earthquake? (Assume 1 year = 365 days) • The y axis is in units of probability-of-earthquake-per-day. The probability of an earthquake within the next 100 years (36,500) days is 1.0, because it’s the area under the “curve” from 0 to 100 years, and the area of the rectangle is 36,500 × 2.74×10-5= 1.0. The probability of an earthquake within the next 40 years is 14,600 days × 2.74×10-5 = 0.4 2.74×10⁻⁵ 0 36500
Computing Probabilities From Probability Density Functions • Example 3:I am waiting for an earthquake. All I know is that it could happen at any time, but it will definitely happen within the next 100 years. My time scale is in millennia. What is the p.d.f.of an earthquake? (Define 1 millenium = 1000 years) • The y axis is in units of probability-of-earthquake-per-millenium. The probability of an earthquake within the next 100 years (0.1 millennia) days is 1.0, because it’s the area under the “curve” from 0 to 0.1, and the area of the rectangle is 0.1 × 10 = 1.0. The probability of an earthquake within the next 40 years is 0.04 × 10= 0.4 10 … 0 1 0.1
Computing Probabilities From Probability Density Functions • For speech recognition, we are given a data point for one frame of speech, and we want to know the probability of observing this data point (or vector of speech features). • The probability of observing any single value along a continuous scale is 0.0, because • and so • The probability of a specific data point (or vector) is then zero.But this will not allow us to perform speech recognition, if theprobability of any and all observations is zero. • In order to obtain useful data, we compute the probability of a specific data point a over a range from a– to a+, and let approach the limit of zero. Furthermore, we multiply the p.d.f. by a scaling function that increases as approaches zero.
Computing Probabilities From Probability Density Functions • Define Dirac delta function: (not really a true function, but close enough) • The value is zero for all values less than a- and for all values greater than a+. The integral over this range is one. Also, approaches zero. • If we multiply this delta function by an arbitrary p.d.f. and integrate, the result is the value of the p.d.f. at point a, as approaches zero: • As approaches zero, the function f(x) approaches the constant value f(a). Constants can be moved outside the integration.
Computing Probabilities From Probability Density Functions • Why does f(x) approach f(a) as approaches zero? • (Generalized) Mean-Value Theorem for Integration:If f(x) is continuous on [b,d], and (x) is an integrable positive function, then there is at least one number c in range (b,d) for which • If b=a- and d=a+, thenand as approaches zero, c approaches a, because a- < c <a+ • From the definition of the delta function, so: 1
3=0.25, (x)=2 2=0.5, (x)=1 f(x), (x) 1=1, (x)=1/2 a 1 1 Computing Probabilities From Probability Density Functions • Example delta functions: • Example of approaching the limit of zero for an arbitrary p.d.f., f(x), using impulse function: (Gaussian) • As decreases, area remains 1, probability of a approaches
Computing Probabilities From Probability Density Functions • So, the probability of an interval approaches zero as the limit approaches zero, but the scaling factor (delta function between a- and a+) approaches infinity. When we integrate the p.d.f. multiplied by the scaling factor, the result is a useful number, namely the value of the p.d.f. at point a. • As long as the p.d.f.s are comparable (have the same y-axis units), we can compare “scaled” probability values of different points. However, if the y-axis units change, then the results need to be normalized in order to be comparable. • The y-axis units change when the x-axis units change, so the normalizing factor will be different when x-axis dimensions are different. • This normalizing factor will be seen later when we combine observation probabilities with language-model probabilities.
Computing Probabilities From Probability Density Functions • For example, the probability of an earthquake at any particular instant should be the same (and non-zero), regardless of whether the scale used to construct the p.d.f. is measured in days, years, or millennia. The same small but non-zero value of , however, represents a distance that is 1000 times larger when the x-axis scale is millennia than when the scale is in years. So we can only compare probabilities after we have normalized by the difference in x-axis units. • If pdfx=millennia(0.05) = 10 and pdfx=years(50) = 0.01but we want p(50years= 0.05millennia) to have the same non-zero probability value at the same time instant, then we can compare or combine p.d.f. “probabilities” only if we normalize, e.g. pdfx=millennia(0.05)/1000 = pdfx=years(50)where the normalizing factor is the difference in x-axis scale. When the x-axis scales have different meanings (e.g. quefrency vs. frequency), the (linear) normalizing factor is not obvious.
Computing Probabilities From Probability Density Functions • In short, we will use p.d.f. values evaluated at a single point (or vector) as the probability of that point (or vector). • These values are not true probabilities, but they do maintain the relative relationship and scale of probabilities that are properly computed over (infinitely) small x-axis regions. These values are commonly referred to (by me and others) incorrectly as probabilities. • As a result: • Combining or comparing “probabilities” from different p.d.f.s may require a (unknown) scaling factor if the dimensions of the p.d.f. axes are different. • “Probability” values obtained from a p.d.f may be greater than 1.0. (Only the integral must be one; any individual point on the p.d.f. (which represents change in probability per x-axis unit) may have any positive value.)
Gaussian Mixture Models • Typical HMMs for speech are continuous-density HMMs • Use Gaussian Mixture Models (GMMs) to estimate “probability” of “emitting” each observation ot given the speech category (state). “probability” feature value = ot • Features observations, “probability” of feature = bj(ot)
probability feature1 feature2 Gaussian Mixture Models • The GMM has the same dimension as the feature space (13 cepstral coefficients = 13-dimensional GMM; 3 formant frequencies = 3-dimensional GMM) • For visualization purposes, here are 2-dimensional GMMs: feature2 feature1
Gaussian Mixture Models • Use of multiple Gaussian components does not assume speech data are Normally distributed (if use enough mixtures) • Use of GMMs is not “discriminatory”: • Having a high probability of being in State 1 doesn’t imply a low probability of being in State 2. The states are independent in terms of their probabilities. probability feature value state 1 state 2 • There are “discriminatory” methods that we’ll talk about later.
1 211 1 0 0 222 1 0 233 0 -1 = 0 0 Gaussian Mixture Models number of mixture components; different from number of events Equations for GMMs: (a) single-dimensional case: mixture weights (b) multi-dimensional case: n is dimension of feature vector becomes vector , becomes covariance matrix . T=transpose, not end time assume is diagonal matrix:
Gaussian Mixture Models • To simplify calculations, assume diagonal matrix for • This assumes lack of correlation among the features • Not true for speech!! (but makes the math easier.) • One reason for using cepstral features = mostly uncorrelated • Some labs (e.g. MIT) have used full covariance matrix • Mean of the ith dimension in multi-dimensional feature array: • Covariance of the ith dimension in multi-dimensional feature array: using N will underestimate 2 for small population sizes
Gaussian Mixture Models • Comparing continuous (GMM) and discrete (VQ) HMMs: • Continuous HMMs: assume independence of features for diagonal matrix require large number of components to represent arbitrary function large number of parameters = relatively slow, can’t always train well small number of components may not represent speech well • Discrete HMMs: quantization errors at boundaries relies on how well VQ partitions the space sometimes problems estimating probabilities when unusual input vector not seen in training