Download
1 / 9
90 likes | 180 Views
2011 Annual Regional Park-and-Ride System Survey. Transportation Committee February 13, 2012 Maurice Roers & Tom Olson Facilities Planning, Metro Transit Elaine Koutsoukos Metropolitan Transportation Services. 2011 Park-and-Ride Survey . Regional partnership

E N D
2011 Annual RegionalPark-and-Ride System Survey Transportation Committee February 13, 2012 Maurice Roers & Tom Olson Facilities Planning, Metro Transit Elaine Koutsoukos Metropolitan Transportation Services
2011 Park-and-Ride Survey • Regional partnership • Conducted late September/early October 2011 • Count usage at 151 park-and-ride/pool facilities • Information used to manage and plan facilities
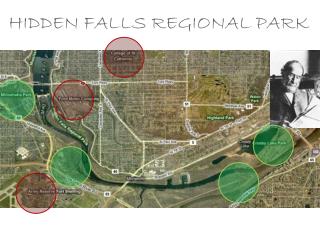
Regional Park-and-Ride System Northstar CRT Hiawatha /Blue Line Capacity less than 200 P Capacity greater than 200 P 110 park-and-rides Primarily suburban express service 13% of total ridership 29 facilities have capacity at 200+ 29,183 total spaces ~18,000 daily users Facility usage ↑ 5.6% Express ridership ↑ 6.3%
System Growth 2002–2011 40,200 Projected 2030 Park-and-Ride Demand Additional capacity from Northstar and UPA
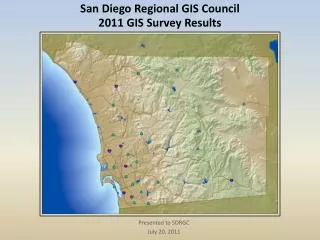
Facilities At- and Over-Capacity At Capacity = 90 to 100% full Over Capacity = 100% or greater Foley Park-n-Ride Facility P Hwy 610 & Noble Small facilities 90% full or more P P Large facilities 90% full or more Maplewood Mall Maple Grove Major Highways Hwy 61 & Co Rd C Northstar CRT Alignment Hiawatha LRT Alignmnet Louisiana Ave Guardian Angels SouthWest Station Fort Snelling Apple Valley