Download
1 / 16
170 likes | 374 Views
Low-Temperature Geothermal Resources for District Heating An Economic Analysis of Geothermal District Heating System by Using ArcGIS. Xiaoning He 1 , Brian J. Anderson 1 Department of Chemical Engineering, West Virginia University Morgantown, WV, 26506, USA Email: brian.anderson@mail.wvu.edu.

E N D
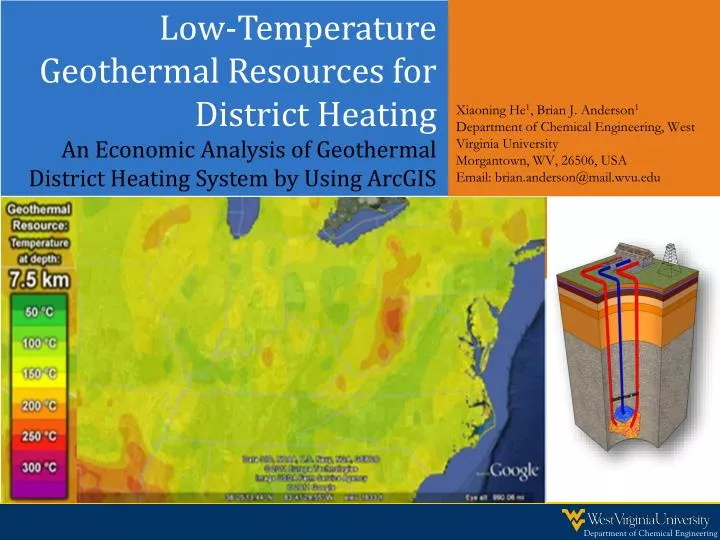
Low-Temperature Geothermal Resources for District Heating An Economic Analysis of Geothermal District Heating System by Using ArcGIS Xiaoning He1, Brian J. Anderson1 Department of Chemical Engineering, West Virginia University Morgantown, WV, 26506, USA Email: brian.anderson@mail.wvu.edu
Outline • Introduction • Modeling Approach • Result and Discussion • Acknowledgements
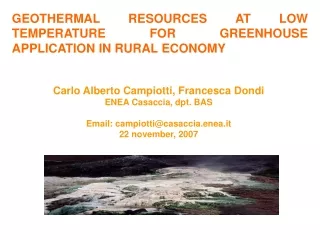
Introduction 70% of whcih for heating and AC • Geothermal energy:stable, environmentally-friendly, renewable, baseload energy supply. • 20% of total energy is used for such low temperature end-use • geothermal energy can satisfy this end-use. 30% of which for heating Figure 1: US Energy consumption scenario[EIA, 2011] “Energy consumption estimates by sector, 1949-2010,” U.S. EIA, 2011
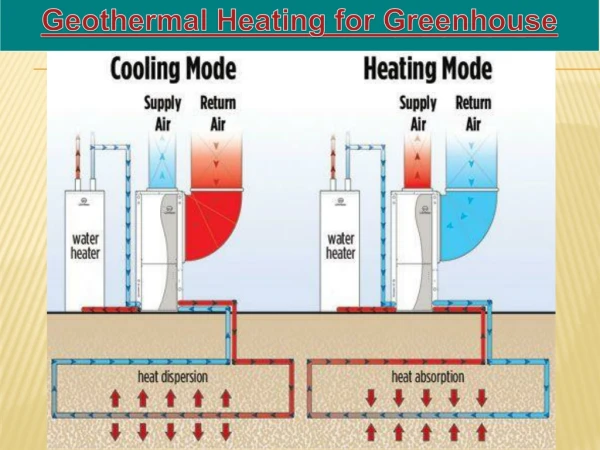
Introduction • Geothermal District Heating System (GDHS) Basics • Injection well and production well • Surface heat exchanger system • Distribution network Distribution Pipeline Figure 2: Two-well Geothermal System Schematic “The Future of Geothermal Energy”, MIT, 2006 Buildings Figure 3: Distribution Network Schematic [NREL, 2004] “H2A Scenarios for Delivering Hydrogen ,” NREL, 2004 Figure 4: Heat Exchanger Schematic
Modeling Approach Include wells’ drilling, surface equipment investment, pipeline network cost, O&M cost, etc. • Levelized cost of geothermal energy • Geothermal gradient factor • Drilling cost may contribute 60% of the initial capital cost. • Population density factor • A high energy demand will reduce the levelized cost as well.
Geothermal Gradient Factor • Data Analysis for each map for each map Python Coding [°C/km] T3~T8 is temperature at depth at 3.5km~8.5km Figure 5: Data Analysis Procedure
Geothermal Gradient Factor • Data Analysis Results °C/km °C Figure 6: Geothermal Temperature at Depth at 3.5 km to 8.5 km Figure 7: Geothermal Gradient Map
Geothermal Gradient Factor • Preliminary Work: WVU Case Study • Location: WVU Evansdale campus • Geothermal gradient: 26.44°C/km • Population: 30,000 students • Heating in winter and cooling in summer • Distribution network: current steam pipeline • Levelized cost of geothermal energy: $5.30/MMBtu • Geothermal Gradient Influence • By changing the gradient • of the case study, and • keeping all the other • factors constant, get and • plot the levelized cost vs. • gradient.
Population Density Factor Q=mCpΔT Q=mCpΔT
Population Density Factor [1]: C. Yang, J.Ogden, “Determining the lowest-cost hydrogen delivery mode”, Institute of Transportation Studies, University of California, Davis, 2006
Population Density Factor • Other functions and assumption used: • Drilling cost(Million $): 1.0910-7D2+8.8310-4D+0.23[1] • Pressure Drop: • dP/dL=2fρv2/ID • Discount rate: 5% • One engineer salary: $70k/year • Operation and Maintenance Cost: $0.0047/kWh [2] • Project’s lifetime: 30 years • Population Density Influence • By changing the household number, therefore changing the population density, and keeping all the other factors constant, get and plot the levelized cost vs. population density [1]: C. Augustine, “Hydrothermal spallation drilling and advanced energy conversion technology for engineered geothermal systems,” Department of Chemical Engineering, Massachusetts Institution of Technology, 2003 [2]: S.K. Sanyal, “Cost of geothermal power and factors that affect it,” Stanford Geothermal Workshop, 2004
Result and Discussion • With the constant population density, the levelized cost decreases with the increase of geothermal gradient. • With the constant geothermal gradient, levelized cost decreases with the increase of population density. ($/MMBtu) Levelized Cost Population Density
Result and Discussion • Gradient Factor (): LC= 0.0031-0.1825+15.128, at P=2100ppl/km2 • Population Density Factor (P): LC=486.2P-0.498, at =25.71 °C/km • LC Function: LC=486.2P-0.498 +0.0031-0.1825+8.3 • Figure 8: 3D levelized cost function
WVU Case Coal Plant Natural Gas Solar Figure 9: Levelized Cost Map of West Virginia
Result and Discussion • To be improved: • Distribution network: estimation of pipeline length is rough. Want to check if ArcMap can be used to develop a distribution network model. • The geothermal gradient is based on the average temperature of each census tract. This makes the geothermal gradient smaller than reality. • Try to find other maps with only middle or big cities, rather than the census tract map. This will save time when doing this model nationwide.
Acknowledgements • Project partners: • Mr. M. G. Bedre and Mr. J. Peluchette • G & G department: • Dr. J. Conley, Dr. G. Elmes and Dr. K. Kuhn • Lab workers: • Ms. N. Garapati, Mr. M. Gaddipati, Mr. S. Velaga • Department of Energy’s Geothermal Technologies Program, Project EE0002745 for funding